Capital One 2008 Annual Report Download - page 95
Download and view the complete annual report
Please find page 95 of the 2008 Capital One annual report below. You can navigate through the pages in the report by either clicking on the pages listed below, or by using the keyword search tool below to find specific information within the annual report.-
 1
1 -
2
-
3
-
4
-
5
-
6
-
7
-
8
-
9
-
10
-
11
-
12
-
13
-
14
-
15
-
16
-
17
-
18
-
19
-
20
-
21
-
22
-
23
-
24
-
25
-
26
-
27
-
28
-
29
-
30
-
31
-
32
-
33
-
34
-
35
-
36
-
37
-
38
-
39
-
40
-
41
-
42
-
43
-
44
-
45
-
46
-
47
-
48
-
49
-
50
-
51
-
52
-
53
-
54
-
55
-
56
-
57
-
58
-
59
-
60
-
61
-
62
-
63
-
64
-
65
-
66
-
67
-
68
-
69
-
70
-
71
-
72
-
73
-
74
-
75
-
76
-
77
-
78
-
79
-
80
-
81
-
82
-
83
-
84
-
 85
85 -
 86
86 -
 87
87 -
 88
88 -
 89
89 -
 90
90 -
 91
91 -
 92
92 -
 93
93 -
 94
94 -
 95
95 -
 96
96 -
 97
97 -
 98
98 -
 99
99 -
 100
100 -
 101
101 -
 102
102 -
 103
103 -
 104
104 -
 105
105 -
106
-
107
-
108
-
109
-
110
-
111
-
112
-
113
-
114
-
115
-
116
-
117
-
118
-
119
-
120
-
121
-
122
-
123
-
124
-
125
-
126
-
127
-
128
-
129
-
130
-
131
-
132
-
133
-
134
-
135
-
136
-
137
-
138
-
139
-
140
-
141
-
142
-
143
-
144
-
145
-
146
-
147
-
148
-
149
-
150
-
151
-
152
-
153
-
154
-
155
-
156
-
157
-
158
-
159
-
160
-
161
-
162
-
163
-
164
-
165
-
166
-
167
-
168
-
169
-
170
-
171
-
172
-
173
-
174
-
175
-
176
-
177
-
178
-
179
-
180
-
181
-
182
-
183
-
184
-
185
-
186
 |
 |

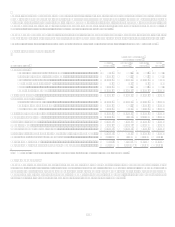
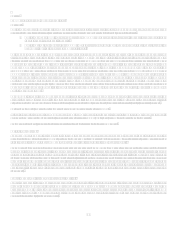
77
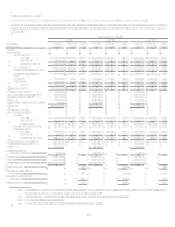
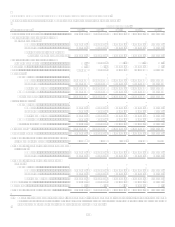
TABLE DCOMPOSITION OF REPORTED LOAN PORTFOLIO
As of December 31
2008
2007
2006
2005
2004
(Dollars in
thousands)
Loans
% of
Total
Loans
Loans
% of
Total
Loans
Loans
% of
Total
Loans
Loans
% of
Total
Loans
Loans
% of
Total
Loans
Reported:
Consumer loans ..........$ 62,232,926 61.61%
$ 64,448,770 63.31% $ 64,767,900 67.11% $ 49,383,370 82.51% $ 35,521,555 92.95%
Commercial loans....... 38,784,845 38.39%
37,356,257 36.69% 31,744,239 32.89% 10,464,311 17.49% 2,694,036 7.05%
Total...............$ 101,017,771 100.00%
$ 101,805,027 100.00% $ 96,512,139 100.00% $ 59,847,681 100.00% $ 38,215,591 100.00%
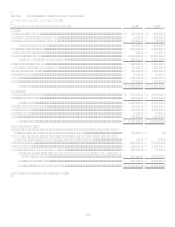
TABLE EDELINQUENCIES
Table E shows the Companys loan delinquency trends for the periods presented on a reported and managed basis.
As of December 31
2008
2007
2006
2005
2004
(Dollars in thousands)
Loans
% of
Total
Loans
Loans
% of
Total
Loans
Loans
% of
Total
Loans
Loans
% of
Total
Loans
Loans
% of
Total
Loans
Reported(1) :
Loans held for investment ..$ 101,017,771 100.00% $ 101,805,027 100.00% $ 96,512,139 100.00% $ 59,847,681 100.00% $ 38,215,591 100.00%
Loans delinquent:
30-59 days .............. 2,325,190 2.30%
2,052,086 2.02% 1,512,365 1.57% 1,055,027 1.76% 741,723 1.94%
60-89 days .............. 1,094,076 1.08%
869,452 0.86% 563,012 0.58% 401,640 0.67% 313,559 0.82%
90-119 days ............ 574,743 0.57%
450,268 0.44% 291,759 0.30% 230,780 0.39% 196,457 0.51%
120-149 days .......... 229,436 0.23%
194,892 0.19% 167,260 0.17% 104,817 0.18% 120,589 0.32%
150 or more days .... 194,378 0.19%
154,746 0.15% 114,007 0.12% 86,744 0.14% 99,866 0.26%
Total............$ 4,417,823 4.37%
$ 3,721,444 3.66% $ 2,648,403 2.74% $ 1,879,008 3.14% $ 1,472,194 3.85%
Loans delinquent by
geographic area:
Domestic................. 4,271,511 4.36%
3,592,845 3.67% 2,543,050 2.74% 1,789,926 3.20% 1,380,022 4.05%
International............ 146,312 4.89%
128,599 3.20% 105,353 2.74% 89,082 2.28% 92,172 2.04%
Managed(2) :
Loans held for investment ..$ 146,936,754 100.00% $ 151,362,417 100.00% $ 146,151,268 100.00% $ 105,527,491 100.00% $ 79,861,299 100.00%
Loans delinquent:
30-59 days .............. 2,987,184 2.03%
2,737,547 1.81% 2,129,884 1.46% 1,620,075 1.54% 1,299,782 1.63%
60-89 days .............. 1,581,659 1.08%
1,343,539 0.89% 945,844 0.65% 740,917 0.70% 664,629 0.83%
90-119 days ............ 981,981 0.67%
840,776 0.55% 602,472 0.41% 498,927 0.47% 479,404 0.60%
120-149 days .......... 569,528 0.39%
512,789 0.34% 412,386 0.28% 309,587 0.29% 336,924 0.42%
150 or more days .... 475,871 0.32%
429,146 0.28% 323,459 0.22% 254,314 0.24% 273,339 0.34%
Total............$ 6,596,223 4.49%
$ 5,863,797 3.87% $ 4,414,045 3.02% $ 3,423,820 3.24% $ 3,054,078 3.82%
Loans delinquent by
geographic area:
Domestic................. 6,080,324 4.40%
5,271,552 3.77% 4,271,511 3.18% 2,900,938 3.06% 2,501,658 3.61%
International............ 515,899 5.92%
592,245 5.08% 589,416 5.02% 522,882 4.91% 552,420 5.24%
(1) Includes non-accrual consumer auto loans of $164.6 million in 2008, $159.8 million in 2007, $82.1 million in 2006, $61.0 million in 2005 and $32.0 million in 2004.
(2) Includes non-accrual consumer auto loans of $164.6 million in 2008, $160.9 million in 2007, $85.6 million in 2006, $67.5 million in 2005 and $32.0 million in 2004.