Capital One 2008 Annual Report Download - page 100
Download and view the complete annual report
Please find page 100 of the 2008 Capital One annual report below. You can navigate through the pages in the report by either clicking on the pages listed below, or by using the keyword search tool below to find specific information within the annual report.-
 1
1 -
2
-
3
-
4
-
5
-
6
-
7
-
8
-
9
-
10
-
11
-
12
-
13
-
14
-
15
-
16
-
17
-
18
-
19
-
20
-
21
-
22
-
23
-
24
-
25
-
26
-
27
-
28
-
29
-
30
-
31
-
32
-
33
-
34
-
35
-
36
-
37
-
38
-
39
-
40
-
41
-
42
-
43
-
44
-
45
-
46
-
47
-
48
-
49
-
50
-
51
-
52
-
53
-
54
-
55
-
56
-
57
-
58
-
59
-
60
-
61
-
62
-
63
-
64
-
65
-
66
-
67
-
68
-
69
-
70
-
71
-
72
-
73
-
74
-
75
-
76
-
77
-
78
-
79
-
80
-
81
-
82
-
83
-
84
-
85
-
86
-
87
-
88
-
89
-
 90
90 -
 91
91 -
 92
92 -
 93
93 -
 94
94 -
 95
95 -
 96
96 -
 97
97 -
 98
98 -
 99
99 -
 100
100 -
 101
101 -
 102
102 -
 103
103 -
 104
104 -
 105
105 -
 106
106 -
 107
107 -
 108
108 -
 109
109 -
 110
110 -
111
-
112
-
113
-
114
-
115
-
116
-
117
-
118
-
119
-
120
-
121
-
122
-
123
-
124
-
125
-
126
-
127
-
128
-
129
-
130
-
131
-
132
-
133
-
134
-
135
-
136
-
137
-
138
-
139
-
140
-
141
-
142
-
143
-
144
-
145
-
146
-
147
-
148
-
149
-
150
-
151
-
152
-
153
-
154
-
155
-
156
-
157
-
158
-
159
-
160
-
161
-
162
-
163
-
164
-
165
-
166
-
167
-
168
-
169
-
170
-
171
-
172
-
173
-
174
-
175
-
176
-
177
-
178
-
179
-
180
-
181
-
182
-
183
-
184
-
185
-
186
 |
 |

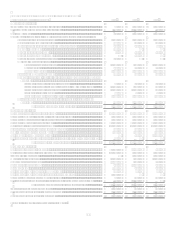
82
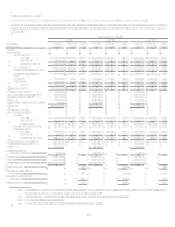
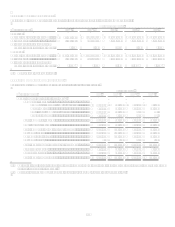
CONSOLIDATED STATEMENTS OF INCOME
Year Ended December 31 (In Thousands, Except Per Share Data)
2008
2007
2006
Interest Income:
Loans held for investment, including past-due fees.....................................................$ 9,460,378 $ 9,500,128 $ 7,046,473
Securities available for sale ......................................................................................... 1,224,012 950,972 676,712
Other ............................................................................................................................ 427,609 627,056 441,550
Total interest income.................................................................................................... 11,111,999 11,078,156 8,164,735
Interest Expense:
Deposits ....................................................................................................................... 2,512,040 2,906,351 1,814,797
Senior and subordinated notes ..................................................................................... 444,854 577,128 411,643
Other borrowings ......................................................................................................... 1,006,390 1,064,832 846,849
Total interest expense .................................................................................................. 3,963,284 4,548,311 3,073,289
Net interest income ...................................................................................................... 7,148,715 6,529,845 5,091,446
Provision for loan and lease losses .............................................................................. 5,101,040 2,636,502 1,476,438
Net interest income after provision for loan and lease losses ...................................... 2,047,675 3,893,343 3,615,008
Non-Interest Income:
Servicing and securitizations ....................................................................................... 3,384,468 4,840,677 4,209,637
Service charges and other customer-related fees ......................................................... 2,232,363 2,057,854 1,770,340
Mortgage servicing and other ...................................................................................... 105,038 166,776 177,893
Interchange .................................................................................................................. 562,117 500,484 549,074
Other ............................................................................................................................ 459,985 488,432 294,080
Total non-interest income ............................................................................................ 6,743,971 8,054,223 7,001,024
Non-Interest Expense:
Salaries and associate benefits ..................................................................................... 2,335,737 2,592,534 2,224,676
Marketing..................................................................................................................... 1,118,208 1,347,836 1,444,324
Communications and data processing.......................................................................... 755,989 758,820 712,001
Supplies and equipment ............................................................................................... 519,687 531,238 460,419
Occupancy ................................................................................................................... 377,192 322,510 215,636
Restructuring expense.................................................................................................. 134,464 138,237
Goodwill impairment................................................................................................... 810,876
Other ............................................................................................................................ 2,157,874 2,386,835 1,886,635
Total non-interest expense ........................................................................................... 8,210,027 8,078,010 6,943,691
Income from continuing operations before income taxes ............................................ 581,619 3,869,556 3,672,341
Income taxes ................................................................................................................ 497,102 1,277,837 1,245,964
Income from continuing operations, net of tax ............................................................ 84,517 2,591,719 2,426,377
Loss from discontinued operations, net of tax ............................................................. (130,515) (1,021,387) (11,884)
Net income (loss).........................................................................................................$ (45,998) $ 1,570,332 $ 2,414,493
Net income (loss) available to common shareholders..................................................$ (78,721) $ 1,570,332 $ 2,414,493
Basic earnings per common share
Income from continuing operations .............................................................................$ 0.14 $ 6.64 $ 7.84
Loss from discontinued operations .............................................................................. (0.35) (2.62) (0.04)
Net income (loss) per common share...........................................................................$ (0.21) $ 4.02 $ 7.80
Diluted earnings per common share
Income from continuing operations .............................................................................$ 0.14 $ 6.55 $ 7.65
Loss from discontinued operations .............................................................................. (0.35) (2.58) (0.03)
Net income (loss) per common share...........................................................................$ (0.21) $ 3.97 $ 7.62
Dividends paid per common share...............................................................................$ 1.50 $ 0.11 $ 0.11
See Notes to Consolidated Financial Statements.