Capital One 2008 Annual Report Download - page 79
Download and view the complete annual report
Please find page 79 of the 2008 Capital One annual report below. You can navigate through the pages in the report by either clicking on the pages listed below, or by using the keyword search tool below to find specific information within the annual report.-
 1
1 -
2
-
3
-
4
-
5
-
6
-
7
-
8
-
9
-
10
-
11
-
12
-
13
-
14
-
15
-
16
-
17
-
18
-
19
-
20
-
21
-
22
-
23
-
24
-
25
-
26
-
27
-
28
-
29
-
30
-
31
-
32
-
33
-
34
-
35
-
36
-
37
-
38
-
39
-
40
-
41
-
42
-
43
-
44
-
45
-
46
-
47
-
48
-
49
-
50
-
51
-
52
-
53
-
54
-
55
-
56
-
57
-
58
-
59
-
60
-
61
-
62
-
63
-
64
-
65
-
66
-
67
-
68
-
 69
69 -
 70
70 -
 71
71 -
 72
72 -
 73
73 -
 74
74 -
 75
75 -
 76
76 -
 77
77 -
 78
78 -
 79
79 -
 80
80 -
 81
81 -
 82
82 -
 83
83 -
 84
84 -
 85
85 -
 86
86 -
 87
87 -
 88
88 -
 89
89 -
90
-
91
-
92
-
93
-
94
-
95
-
96
-
97
-
98
-
99
-
100
-
101
-
102
-
103
-
104
-
105
-
106
-
107
-
108
-
109
-
110
-
111
-
112
-
113
-
114
-
115
-
116
-
117
-
118
-
119
-
120
-
121
-
122
-
123
-
124
-
125
-
126
-
127
-
128
-
129
-
130
-
131
-
132
-
133
-
134
-
135
-
136
-
137
-
138
-
139
-
140
-
141
-
142
-
143
-
144
-
145
-
146
-
147
-
148
-
149
-
150
-
151
-
152
-
153
-
154
-
155
-
156
-
157
-
158
-
159
-
160
-
161
-
162
-
163
-
164
-
165
-
166
-
167
-
168
-
169
-
170
-
171
-
172
-
173
-
174
-
175
-
176
-
177
-
178
-
179
-
180
-
181
-
182
-
183
-
184
-
185
-
186
 |
 |
61
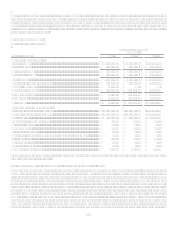
The International sub-segment consists of U.K. and Canada lending activities.
Year Ended December 31, 2008 Compared to Year Ended December 31, 2007
Net income for the International sub-segment decreased 51% from 2007 to 2008. Excluding the $31.3 million net gain on the sale of
an interest in Spain booked in Q4 2007, full year net income decreased 38% from 2007. This year over year decline was driven by
lower revenue in the U.K. due to lower loans held for investment of $2.9 billion as the business continues to focus its long term
strategy on more resilient product offerings, coupled with foreign exchange movements over the period, which accounted for $2.2
billion of the decrease. U.K. non-interest expense declined by 18% from 2007 driven by a continued focus on efficiency and the
realization of full year savings from the outsourcing initiative implemented in 2007. Canadas net income rose a modest 2% from
2007 in U.S. dollars and was flat in local currency, primarily due to higher net interest income driven by higher outstandings, offset by
a higher provision for loan and lease losses, as economic indicators in the Canadian economy have recently begun to show a spillover
effect from the U.S.
The net charge-off rate for the International sub-segment in 2008 was 5.77%, an increase of 14 basis points compared to 5.63% for
2007. The increase in the net charge-off rate is largely the result of worsening credit quality trends in both the U.K. and Canada.
Year Ended December 31, 2007 Compared to Year Ended December 31, 2006
Net income for the International sub-segment increased 354% from 2006 to 2007. Excluding the $31.3 million net gain on the sale of
an interest in Spain, net income increased 252% from 2006. Profitability improved year over year in both the Canada and U.K.
businesses driven by underlying growth as well as foreign exchange movements over the period. In the U.K., credit conditions eased
substantially from 2006, causing a 19% decline in the provision for loan and lease losses. Additionally, the U.K. business saw modest
improvements in its efficiency ratio as it implemented several cost initiatives over the period. Our Canadian business saw significant
growth from 2006 to 2007, driven by 8% local currency outstandings growth and significant appreciation of the Canadian dollar to the
U.S. dollar over the comparison period. This growth, coupled with improvements in both revenue margin and operating efficiency, led
to a 40% year-over-year increase in net income.
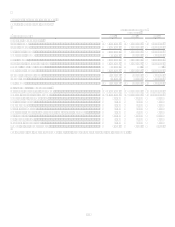
VIII. Liquidity and Funding
The Company manages liquidity risk to ensure that we can fund asset and loan growth, debt and deposit maturities and withdrawals,
and payments of other corporate obligations. To achieve this, the Companys Asset/Liability Management Committee and Finance
Committee establish liquidity guidelines to ensure that the Company can withstand significant degradation in the funding markets. The
Company seeks to maintain a large liquidity reserve to guard against possible degradation. This reserve is comprised of cash,
unencumbered securities available for sale and undrawn committed facilities. The current economic environment could have an
adverse impact on our asset values, including our securities available for sale, and impact our ability to borrow funds or engage in
securitization transactions. See Section 1A. Risk Factors for additional information.
The Company uses a variety of funding sources to establish a maturity pattern that provides a prudent mixture of short-term and long-
term funds. The Company obtains funds through the gathering of deposits, issuing debt and equity securities, and securitizing assets.
Further liquidity is available to the Company through committed facilities, including undrawn conduits, FHLB advances and recently
enacted government programs.
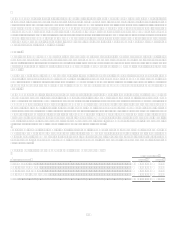
Cash and Cash Equivalents
The Company held $7.5 billion of cash and cash equivalents at December 31, 2008, compared to $4.8 billion of cash and cash
equivalents at December 31, 2007. Cash and cash equivalents provide immediate sources of funds to meet the Companys liquidity
needs, including dividend payments and other funding obligations.
Securities Available for Sale
The Company held $31.0 billion in available for sale investment securities, of which $13.7 billion was pledged available-for-sale
investment securities at December 31, 2008, compared to $19.8 billion in available for sale investment securities, of which $9.3 billion
was pledged available-for-sale investment securities at December 31, 2007. As of December 31, 2008, the weighted average life of the
investment securities was approximately 2.6 years. These investment securities provide increased liquidity and flexibility to support
the Companys funding requirements.