Capital One 2008 Annual Report Download - page 68
Download and view the complete annual report
Please find page 68 of the 2008 Capital One annual report below. You can navigate through the pages in the report by either clicking on the pages listed below, or by using the keyword search tool below to find specific information within the annual report.-
 1
1 -
2
-
3
-
4
-
5
-
6
-
7
-
8
-
9
-
10
-
11
-
12
-
13
-
14
-
15
-
16
-
17
-
18
-
19
-
20
-
21
-
22
-
23
-
24
-
25
-
26
-
27
-
28
-
29
-
30
-
31
-
32
-
33
-
34
-
35
-
36
-
37
-
38
-
39
-
40
-
41
-
42
-
43
-
44
-
45
-
46
-
47
-
48
-
49
-
50
-
51
-
52
-
53
-
54
-
55
-
56
-
57
-
 58
58 -
 59
59 -
 60
60 -
 61
61 -
 62
62 -
 63
63 -
 64
64 -
 65
65 -
 66
66 -
 67
67 -
 68
68 -
 69
69 -
 70
70 -
 71
71 -
 72
72 -
 73
73 -
 74
74 -
 75
75 -
 76
76 -
 77
77 -
 78
78 -
79
-
80
-
81
-
82
-
83
-
84
-
85
-
86
-
87
-
88
-
89
-
90
-
91
-
92
-
93
-
94
-
95
-
96
-
97
-
98
-
99
-
100
-
101
-
102
-
103
-
104
-
105
-
106
-
107
-
108
-
109
-
110
-
111
-
112
-
113
-
114
-
115
-
116
-
117
-
118
-
119
-
120
-
121
-
122
-
123
-
124
-
125
-
126
-
127
-
128
-
129
-
130
-
131
-
132
-
133
-
134
-
135
-
136
-
137
-
138
-
139
-
140
-
141
-
142
-
143
-
144
-
145
-
146
-
147
-
148
-
149
-
150
-
151
-
152
-
153
-
154
-
155
-
156
-
157
-
158
-
159
-
160
-
161
-
162
-
163
-
164
-
165
-
166
-
167
-
168
-
169
-
170
-
171
-
172
-
173
-
174
-
175
-
176
-
177
-
178
-
179
-
180
-
181
-
182
-
183
-
184
-
185
-
186
 |
 |
50
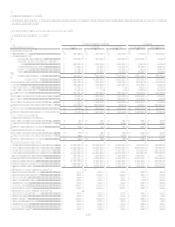
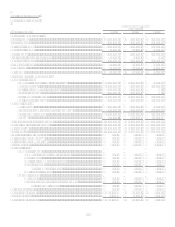
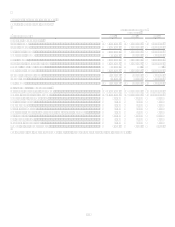
For additional information, see section XI, Tabular Summary, Table C and Table D.
Asset Quality
Delinquencies
The Company believes delinquencies to be an indicator of loan portfolio credit quality at a point in time.
The 30-plus day delinquency rate for the reported and managed loan portfolio increased 71 and 62 basis points to 4.37% and 4.49%,
respectively, from December 31, 2007 to December 31, 2008. The increase was due to the continued worsening of the economy which
rapidly deteriorated during the second half of 2008 impacting both the National Lending and Local Banking segments.
The 30-plus day delinquency rate for the reported and managed loan portfolio increased 92 and 85 basis points to 3.66% and 3.87%,
respectively, from December 31, 2006 to December 31, 2007. The acquisition of the lower loss North Fork loan portfolio reduced
reported and managed delinquency rates. The decrease was offset by normalization of credit following the unusually favorable credit
environment in 2006, selective pricing and fee policy moves in the U.S. Card sub-segment, the significant pull back from prime
revolver marketing in the U.S. Card sub-segment, continued elevated losses in the Auto Finance sub-segment, and from economic
weakening evidenced by increased delinquencies and consistent with recently released economic indicators.
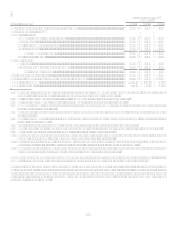
For additional information, see section XI, Tabular Summary, Table E.
Net Charge-Offs
Net charge-offs include the principal amount of losses (excluding accrued and unpaid finance charges and fees and fraud losses) less
current period principal recoveries. We charge-off credit card loans at 180 days past the statement cycle date and generally charge-off
other consumer loans at 120 days past the due date or upon repossession of collateral. Bankruptcies charge-off within 30 days of
notification and deceased accounts charge-off within 60 days of notification. Commercial loans are charged-off when the amounts are
deemed uncollectible. Costs to recover previously charged-off accounts are recorded as collection expenses in other non-interest
expense.
For 2008, reported and managed net charge-off rates increased 141 basis points and 147 basis points to 3.51% and 4.35%,
respectively. The increase in both the reported and managed charge-off rates was due to the continued worsening of the economy
which rapidly deteriorated during the second half of 2008. The reported charge-off dollars totaled $3.5 billion during 2008, an increase
of 77% from 2007. The managed charge-off dollars totaled $6.4 billion, increasing 54% from 2007.
For 2007 reported and managed net charge-off rates decreased 11 basis points to 2.10% and increased 4 basis points to 2.88%,
respectively. The decrease in the reported charge-off rate was impacted by the higher credit quality North Fork loan portfolio for a full
year 2007 which more than offset the effects of continued consumer credit normalization and economic weakness during the latter part
of 2007. The impacts of the continued credit normalization and economic weakness also had a significant impact on the managed
charge-off rate for the Companys credit card securitization programs. Year-to-date reported and managed net charge-off dollars
increased 39% and 32%, respectively, compared to the prior year.
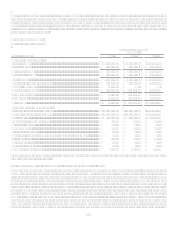
For additional information, see section XI, Tabular Summary, Table F.
Nonperforming Loans
Nonperforming loans as a percentage of total loans held for investment were 0.80% and 0.39% at December 31, 2008 and 2007,
respectively. The increase in nonperforming loans was due to the continued economic weakening and credit deterioration during 2008.
For additional information, see section XI, Tabular Summary, Table G.
Allowance for loan and lease losses
The allowance for loan and lease losses related to loans held for investment increased $1.5 billion, or 53% to $4.5 billion at
December 31, 2008. The increase is due to the continued worsening of the economy which rapidly deteriorated during the second half
of 2008 increasing our expectation of credit losses in 2009. Certain factors impacting the calculation of the allowance for loan and
lease losses, such as the unemployment rate and housing prices, showed significant worsening during the fourth quarter of 2008
contributing to a $1.0 billion increase in the allowance for loan and lease losses during the fourth quarter alone.
The allowance for loan and lease losses related to loans held for investment increased $783.0 million, or 36% to $3.0 billion at
December 31, 2007. The increase is driven primarily by an increase in our coverage ratio of allowance to loans held for investment as
a result of economic weakening in the latter part of 2007 as evidenced by increased delinquencies and consistent with recently
released economic indicators.