Capital One 2008 Annual Report Download - page 64
Download and view the complete annual report
Please find page 64 of the 2008 Capital One annual report below. You can navigate through the pages in the report by either clicking on the pages listed below, or by using the keyword search tool below to find specific information within the annual report.-
 1
1 -
2
-
3
-
4
-
5
-
6
-
7
-
8
-
9
-
10
-
11
-
12
-
13
-
14
-
15
-
16
-
17
-
18
-
19
-
20
-
21
-
22
-
23
-
24
-
25
-
26
-
27
-
28
-
29
-
30
-
31
-
32
-
33
-
34
-
35
-
36
-
37
-
38
-
39
-
40
-
41
-
42
-
43
-
44
-
45
-
46
-
47
-
48
-
49
-
50
-
51
-
52
-
53
-
 54
54 -
 55
55 -
 56
56 -
 57
57 -
 58
58 -
 59
59 -
 60
60 -
 61
61 -
 62
62 -
 63
63 -
 64
64 -
 65
65 -
 66
66 -
 67
67 -
 68
68 -
 69
69 -
 70
70 -
 71
71 -
 72
72 -
 73
73 -
 74
74 -
75
-
76
-
77
-
78
-
79
-
80
-
81
-
82
-
83
-
84
-
85
-
86
-
87
-
88
-
89
-
90
-
91
-
92
-
93
-
94
-
95
-
96
-
97
-
98
-
99
-
100
-
101
-
102
-
103
-
104
-
105
-
106
-
107
-
108
-
109
-
110
-
111
-
112
-
113
-
114
-
115
-
116
-
117
-
118
-
119
-
120
-
121
-
122
-
123
-
124
-
125
-
126
-
127
-
128
-
129
-
130
-
131
-
132
-
133
-
134
-
135
-
136
-
137
-
138
-
139
-
140
-
141
-
142
-
143
-
144
-
145
-
146
-
147
-
148
-
149
-
150
-
151
-
152
-
153
-
154
-
155
-
156
-
157
-
158
-
159
-
160
-
161
-
162
-
163
-
164
-
165
-
166
-
167
-
168
-
169
-
170
-
171
-
172
-
173
-
174
-
175
-
176
-
177
-
178
-
179
-
180
-
181
-
182
-
183
-
184
-
185
-
186
 |
 |

46
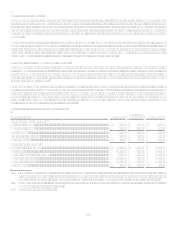
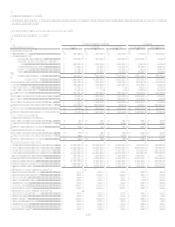
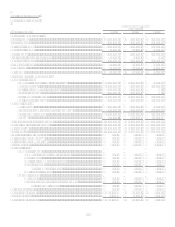
VI. Financial Summary
Table 1 provides a summary view of the consolidated income statement and selected metrics at and for the years ended December 31,
2008, 2007 and 2006.
CAPITAL ONE FINANCIAL CORPORATION
Table 1: Financial Summary
Year Ended December 31,
Change
(Dollars in thousands) 2008
2007(2)
2006(4)(2)
2008 vs. 2007
2007 vs. 2006
Earnings (Reported):
Net Interest Income ....................................................... $ 7,148,715
$ 6,529,845 $ 5,091,446 $ 618,870 $ 1,438,399
Non-Interest Income:
Servicing and securitizations............................. 3,384,468
4,840,677 4,209,637 (1,456,209) 631,040
Service charges and other customer-related
fees............................................................... 2,232,363
2,057,854 1,770,340 174,509 287,514
Mortgage servicing and other............................ 105,038
166,776 177,893 (61,738) (11,117)
Interchange ........................................................ 562,117
500,484 549,074 61,633 (48,590)
Other .................................................................. 459,985
488,432 294,080 (28,447) 194,352
Total non-interest income ................................. 6,743,971
8,054,223 7,001,024 (1,310,252) 1,053,199
Total Revenue(1) .................................... 13,892,686
14,584,068 12,092,470 (691,382) 2,491,598
Provision for loan and lease losses................................ 5,101,040
2,636,502 1,476,438 2,464,538 1,160,064
Marketing....................................................................... 1,118,208
1,347,836 1,444,324 (229,628) (96,488)
Restructuring expenses.................................................. 134,464
138,237 (3,773) 138,237
Goodwill impairment charge(8)...................................... 810,876
810,876 138,237
Operating expenses........................................................ 6,146,479
6,591,937 5,499,367 (445,458) 1,092,570
Income from continuing operations before taxes.......... 581,619
3,869,556 3,672,341 (3,287,937) 197,215
Income taxes .................................................................. 497,102
1,277,837 1,245,964 (780,735) 31,873
Income from continuing operations, net of tax ............. 84,517
2,591,719 2,426,377 (2,507,202) 165,342
Loss from discontinued operations, net of tax(5) ........... (130,515) (1,021,387) (11,884) 890,872 (1,009,503)
Net income (loss)........................................................... $ (45,998) $ 1,570,332 $ 2,414,493 $ (1,616,330 ) $ (844,161)
Net income (loss) available to common shareholders .. $ (78,721) $ 1,570,332 $ 2,414,493 $ (1,649,053 ) $ (844,161)
Common Share Statistics:
Basic earnings per common share:
Income from continuing operations, net of tax ............. $ 0.14
$ 6.64 $ 7.84 $ (6.50) $ (1.20)
Loss from discontinued operations, net of tax(5) ........... (0.35) (2.62) (0.04) 2.27 (2.58)
Net Income (loss) per common share............................ $ (0.21) $ 4.02 $ 7.80 $ (4.23) $ (3.78)
Diluted earnings per common share:
Income from continuing operations, net of tax ............. $ 0.14
$ 6.55 $ 7.65 $ (6.41) $ (1.10)
Loss from discontinued operations, net of tax(5) ........... (0.35) (2.58) (0.03) 2.23 (2.55)
Net Income (loss) per common share............................ $ (0.21) $ 3.97 $ 7.62 $ (4.18) $ (3.65)
Selected Balance Sheet Data(3):
Reported loans held for investment (period end).......... $ 101,017,771
$ 101,805,027 $ 96,512,139 $ (787,256) $ 5,292,888
Managed loans held for investment (period end) ......... 146,936,754
151,362,417 146,151,268 (4,425,663) 5,211,149
Reported loans held for investment (average) .............. 98,970,902
93,541,825 63,577,279 5,429,077 29,964,546
Managed loans held for investment (average) .............. 147,812,265
144,727,006 111,328,595 3,085,259 33,398,411
Allowance for loan and lease losses.............................. 4,523,960
2,963,000 2,180,000 1,560,960 783,000
Interest bearing deposits (period end)........................... 97,326,937
71,714,627 73,913,876 25,612,310 (2,199,249)
Total deposits (period end)............................................ 108,620,789
82,761,176 85,561,946 25,859,613 (2,800,770)
Interest bearing deposits (average)................................ 82,735,627
73,764,911 45,592,382 8,970,716 28,172,529
Total deposits (average) ................................................ $ 93,507,646
$ 85,211,616 $ 50,526,789 $ 8,296,030 $ 34,684,827
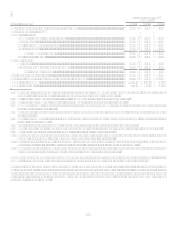
Selected Company Metrics (Reported) (3):
Return on average assets (ROA) ................................... 0.05% 1.79% 2.55% (1.74) (0.76)
Return on average equity (ROE)................................... 0.33% 10.28% 14.97% (9.95) (4.69)
Net charge-off rate......................................................... 3.51% 2.10% 2.21% 1.41 (0.11)
Delinquency rate (30+ days) ......................................... 4.37% 3.66% 2.74% 0.71 (0.92)
Net interest margin ........................................................ 5.37% 5.38% 6.06% (0.01) (0.68)
Revenue margin............................................................. 10.44% 12.01% 14.38% (1.57) (2.37)
Risk adjusted margin (6) ................................................. 7.83% 10.40% 12.71% (2.57) (2.31)
Selected Company Metrics (Managed) (3):
Return on average assets (ROA) ................................... 0.04% 1.33% 1.70% (1.04) (0.37)
Net charge-off rate......................................................... 4.35% 2.88% 2.84% 1.47 0.04
Efficiency ratio (7) .......................................................... 43.14% 47.30% 50.17% (4.16) (2.87)
Delinquency rate (30+ days) ......................................... 4.49% 3.87% 3.02% 0.62 0.85
Net interest margin ........................................................ 6.37% 6.46% 6.88% (0.09) (0.42)
Revenue margin............................................................. 9.39% 9.85% 10.66% (0.46) (0.81)
Risk adjusted margin (6) ................................................. 5.81% 7.40% 8.23% (1.59) (0.83)