Capital One 2008 Annual Report Download - page 120
Download and view the complete annual report
Please find page 120 of the 2008 Capital One annual report below. You can navigate through the pages in the report by either clicking on the pages listed below, or by using the keyword search tool below to find specific information within the annual report.-
 1
1 -
2
-
3
-
4
-
5
-
6
-
7
-
8
-
9
-
10
-
11
-
12
-
13
-
14
-
15
-
16
-
17
-
18
-
19
-
20
-
21
-
22
-
23
-
24
-
25
-
26
-
27
-
28
-
29
-
30
-
31
-
32
-
33
-
34
-
35
-
36
-
37
-
38
-
39
-
40
-
41
-
42
-
43
-
44
-
45
-
46
-
47
-
48
-
49
-
50
-
51
-
52
-
53
-
54
-
55
-
56
-
57
-
58
-
59
-
60
-
61
-
62
-
63
-
64
-
65
-
66
-
67
-
68
-
69
-
70
-
71
-
72
-
73
-
74
-
75
-
76
-
77
-
78
-
79
-
80
-
81
-
82
-
83
-
84
-
85
-
86
-
87
-
88
-
89
-
90
-
91
-
92
-
93
-
94
-
95
-
96
-
97
-
98
-
99
-
100
-
101
-
102
-
103
-
104
-
105
-
106
-
107
-
108
-
109
-
 110
110 -
 111
111 -
 112
112 -
 113
113 -
 114
114 -
 115
115 -
 116
116 -
 117
117 -
 118
118 -
 119
119 -
 120
120 -
 121
121 -
 122
122 -
 123
123 -
 124
124 -
 125
125 -
 126
126 -
 127
127 -
 128
128 -
 129
129 -
 130
130 -
131
-
132
-
133
-
134
-
135
-
136
-
137
-
138
-
139
-
140
-
141
-
142
-
143
-
144
-
145
-
146
-
147
-
148
-
149
-
150
-
151
-
152
-
153
-
154
-
155
-
156
-
157
-
158
-
159
-
160
-
161
-
162
-
163
-
164
-
165
-
166
-
167
-
168
-
169
-
170
-
171
-
172
-
173
-
174
-
175
-
176
-
177
-
178
-
179
-
180
-
181
-
182
-
183
-
184
-
185
-
186
 |
 |

102
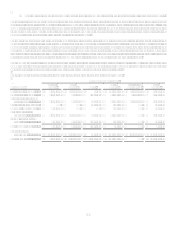
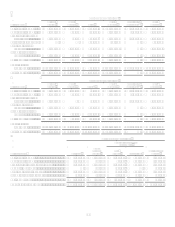
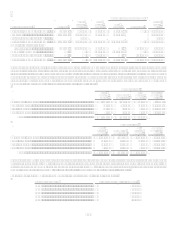
Expected Maturity Schedule(1)
1 Year
or Less
15
Years
510
Years
Over 10
Years
Market
Value
Totals
Amortized
Cost Totals
Non GSE .........................................
.
25,485 2,847,786 31,004 7,209 2,911,484 2,920,845
Total CMO ......................................
.
57,951 8,347,975 441,936 7,209 8,855,071 8,856,897
Mortgage backed securities
Fannie Mae......................................
.
22,839 3,376,353 121,978 3,521,170 3,496,254
Freddie Mac.....................................
.
187 1,586,909 238,687 1,825,783 1,833,879
Other GSE .......................................
.
3,049 110,262 107,979 221,290 220,152
Non GSE .........................................
.
1,488,653 1,488,653 1,489,676
Total MBS.......................................
.
26,075 6,562,177 468,644 7,056,896 7,039,961
Asset backed securities .............................
.
225,262 1,514,146 52,485 1,791,893 1,796,531
Other .........................................................
.
316,274 165,771 52,945 156,434 691,424 696,091
Total..........................................................
.
$ 1,170,383 $ 17,209,577 $ 1,237,984 $ 163,643 $ 19,781,587 $ 19,759,317
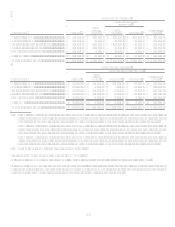
December 31, 2006(1)
U.S. Treasury and other U.S.
government agency obligations
U.S. Treasury...................................
.
$ $ 115,091 $ 112,066 $ $ 227,157 $ 232,298
Fannie Mae......................................
.
224,675 745,467 29,175 999,317 1,006,724
Freddie Mac.....................................
.
148,131 315,727 97,469 561,327 571,019
Other GSE .......................................
.
49,546 228,074 991 278,611 280,532
Total U.S. Treasury and other U.S.
Government agency obligations .
.
422,352 1,404,359 238,710 991 2,066,412 2,090,573
Collateralized mortgage obligations
Fannie Mae......................................
.
25,346 1,253,198 136,627 1,415,171 1,430,629
Freddie Mac.....................................
.
12,400 3,688,955 187,114 3,888,469 3,930,347
Other GSE .......................................
.
215,459 7,659 223,118 225,740
Non GSE .........................................
.
8,748 902,681 32,076 7,315 950,820 966,571
Total CMO ......................................
.
46,494 6,060,293 363,476 7,315 6,477,578 6,553,287
Mortgage backed securities
Fannie Mae......................................
.
314 3,037,593 413,527 17,392 3,468,826 3,484,867
Freddie Mac.....................................
.
21 576,705 236,076 812,802 828,915
Other GSE .......................................
.
5,939 77,890 28,550 2,895 115,274 115,538
Total MBS.......................................
.
6,274 3,692,188 678,153 20,287 4,396,902 4,429,320
Asset backed securities .............................
.
150,367 995,856 20,799 1,167,022 1,176,543
Other .........................................................
.
573,830 205,383 154,268 410,652 1,344,133 1,294,608
Total..........................................................
.
$ 1,199,317 $ 12,358,079 $ 1,455,406 $ 439,245 $ 15,452,047 $ 15,544,331
(1) Certain information as of December 31, 2007, and 2006 has been revised in these tables from the versions that appeared in prior
10-Ks to correct certain expected maturity information and to reclassify securities among investment categories and make
certain other immaterial revisions. Information as of December 31, 2006, has been revised to reflect that expected maturities are
based on weighted average remaining life instead of contractual life, which resulted in certain investments shifting from the
category of securities with expected maturities over 10 years to the category of securities with expected maturities of 1-5 years.
Further, information for the periods ended December 31, 2006, and December 31, 2007, has been revised to reclassify securities
among investment categories so that all tables in this Note reflect consistent classification of securities among investment
categories.
(2) Other GSE and FDIC Debt Guarantee Program (DGP) include investments in senior unsecured debt issued under the DGP of
$542.5 million in market value as of December 31, 2008.