Capital One 2008 Annual Report Download - page 80
Download and view the complete annual report
Please find page 80 of the 2008 Capital One annual report below. You can navigate through the pages in the report by either clicking on the pages listed below, or by using the keyword search tool below to find specific information within the annual report.-
 1
1 -
2
-
3
-
4
-
5
-
6
-
7
-
8
-
9
-
10
-
11
-
12
-
13
-
14
-
15
-
16
-
17
-
18
-
19
-
20
-
21
-
22
-
23
-
24
-
25
-
26
-
27
-
28
-
29
-
30
-
31
-
32
-
33
-
34
-
35
-
36
-
37
-
38
-
39
-
40
-
41
-
42
-
43
-
44
-
45
-
46
-
47
-
48
-
49
-
50
-
51
-
52
-
53
-
54
-
55
-
56
-
57
-
58
-
59
-
60
-
61
-
62
-
63
-
64
-
65
-
66
-
67
-
68
-
69
-
 70
70 -
 71
71 -
 72
72 -
 73
73 -
 74
74 -
 75
75 -
 76
76 -
 77
77 -
 78
78 -
 79
79 -
 80
80 -
 81
81 -
 82
82 -
 83
83 -
 84
84 -
 85
85 -
 86
86 -
 87
87 -
 88
88 -
 89
89 -
 90
90 -
91
-
92
-
93
-
94
-
95
-
96
-
97
-
98
-
99
-
100
-
101
-
102
-
103
-
104
-
105
-
106
-
107
-
108
-
109
-
110
-
111
-
112
-
113
-
114
-
115
-
116
-
117
-
118
-
119
-
120
-
121
-
122
-
123
-
124
-
125
-
126
-
127
-
128
-
129
-
130
-
131
-
132
-
133
-
134
-
135
-
136
-
137
-
138
-
139
-
140
-
141
-
142
-
143
-
144
-
145
-
146
-
147
-
148
-
149
-
150
-
151
-
152
-
153
-
154
-
155
-
156
-
157
-
158
-
159
-
160
-
161
-
162
-
163
-
164
-
165
-
166
-
167
-
168
-
169
-
170
-
171
-
172
-
173
-
174
-
175
-
176
-
177
-
178
-
179
-
180
-
181
-
182
-
183
-
184
-
185
-
186
 |
 |

62
The Company monitors the available for sale investment securities for other-then-temporary impairment based on a number of criteria,
including the size of the unrealized loss position, the duration for which the security has been in a loss position, credit rating, the
nature of the investments, current market conditions and the Companys intent and ability to hold the securities until anticipated
recovery, which may be upon maturity. The Company recognized other-than-temporary impairment charges of $10.9 million for the
year ended December 31, 2008. No other-than-temporary impairment was recognized for the year ended December 31, 2007. The
available for sale investment securities had net unrealized losses of $1.1 billion as of December 31, 2008, and net unrealized gains of
$22.3 million as of December 31, 2007. The Company has the ability and intent to hold these investments until a recovery of fair
value, which may be maturity. For additional information see Item 8. Financial Statements and Supplementary Date Notes to the
Consolidated Financial Statements Note 4.
Deposits
Deposits have become the Companys largest funding source. Deposits provide a stable, low-cost source of funds that we utilize to
fund loan and asset growth and to diversify funding sources. The Company has continued to expand its deposit gathering efforts
through its direct and indirect marketing channels, the existing branch network and through de novo branch expansion. These channels
offer a broad set of deposit products that include demand deposits, money market deposits, NOW accounts, and certificates of deposit
(CDs).
As of December 31, 2008, the Company had $108.6 billion in deposits of which $2.7 billion were held in foreign banking offices and
$11.3 billion represented large domestic denomination certificates of $100 thousand or more. The Companys core deposits are
comprised of domestic non-interest bearing deposits, NOW accounts, money market deposit accounts, savings accounts, CDs of less
than $100,000 and other consumer time deposits. The Company maintains a Grand Cayman branch for issuing Eurodollar time
deposits.
The Company has deposits that are obtained through the use of a third-party intermediary. Included in these deposits at December 31,
2008 were brokered deposits of $26.9 billion, compared to $6.9 billion at December 31, 2007. These deposits represented 24.8% and
8.3% of total deposits at December 31, 2008 and 2007, respectively. If these brokered deposits are not renewed at maturity, the
Company would use its investment securities and money market instruments in addition to alternative funding sources to fund
increases in loans and meet its other liquidity needs. The Federal Deposit Insurance Corporation Improvement Act of 1991 limits the
use of brokered deposits to well-capitalized insured depository institutions and, with a waiver from the Federal Deposit Insurance
Corporation, to adequately capitalized institutions. At December 31, 2008, the Banks and the Corporation were well-capitalized as
defined under the federal banking regulatory guidelines. Based on the Companys historical access to the brokered deposit market, it
expects to replace maturing brokered deposits with new brokered deposits or with the Companys direct deposits. Brokered deposits
are included in other consumer time deposits and money market deposit accounts.
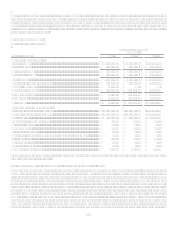
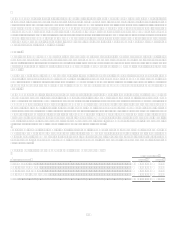
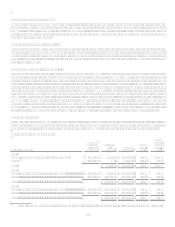
Table 8 shows the maturities of domestic time certificates of deposit in denominations of $100 thousand or more (large denomination
CDs) as of December 31, 2008. Based on past deposit activity, the Company expects to retain a portion of its deposit balances as they
mature. Therefore, the Company anticipates the net cash outflow related to deposits within the next year will be significantly less than
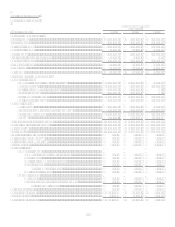
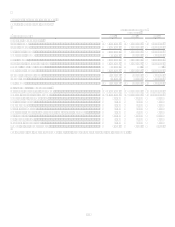
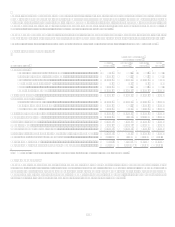
reported in Table 8. Table 9 shows the composition of period end deposits, average deposits and the average deposit rate for the
periods presented.
Table 8: Maturities of Large Denomination Certificates$100,000 or More
December 31, 2008
(Dollars in thousands)
Balance
Percent
Three months or less...................................................................................................................................... $ 1,683,153 15.0%
Over 3 through 6 months............................................................................................................................... 1,820,956 16.1%
Over 6 through 12 months............................................................................................................................. 3,319,048 29.5%
Over 12 months through 10 years.................................................................................................................. 4,435,887 39.4%
Total .............................................................................................................................................................. $ 11,259,044 100.0%