Capital One 2008 Annual Report Download - page 93
Download and view the complete annual report
Please find page 93 of the 2008 Capital One annual report below. You can navigate through the pages in the report by either clicking on the pages listed below, or by using the keyword search tool below to find specific information within the annual report.-
 1
1 -
2
-
3
-
4
-
5
-
6
-
7
-
8
-
9
-
10
-
11
-
12
-
13
-
14
-
15
-
16
-
17
-
18
-
19
-
20
-
21
-
22
-
23
-
24
-
25
-
26
-
27
-
28
-
29
-
30
-
31
-
32
-
33
-
34
-
35
-
36
-
37
-
38
-
39
-
40
-
41
-
42
-
43
-
44
-
45
-
46
-
47
-
48
-
49
-
50
-
51
-
52
-
53
-
54
-
55
-
56
-
57
-
58
-
59
-
60
-
61
-
62
-
63
-
64
-
65
-
66
-
67
-
68
-
69
-
70
-
71
-
72
-
73
-
74
-
75
-
76
-
77
-
78
-
79
-
80
-
81
-
82
-
 83
83 -
 84
84 -
 85
85 -
 86
86 -
 87
87 -
 88
88 -
 89
89 -
 90
90 -
 91
91 -
 92
92 -
 93
93 -
 94
94 -
 95
95 -
 96
96 -
 97
97 -
 98
98 -
 99
99 -
 100
100 -
 101
101 -
 102
102 -
 103
103 -
104
-
105
-
106
-
107
-
108
-
109
-
110
-
111
-
112
-
113
-
114
-
115
-
116
-
117
-
118
-
119
-
120
-
121
-
122
-
123
-
124
-
125
-
126
-
127
-
128
-
129
-
130
-
131
-
132
-
133
-
134
-
135
-
136
-
137
-
138
-
139
-
140
-
141
-
142
-
143
-
144
-
145
-
146
-
147
-
148
-
149
-
150
-
151
-
152
-
153
-
154
-
155
-
156
-
157
-
158
-
159
-
160
-
161
-
162
-
163
-
164
-
165
-
166
-
167
-
168
-
169
-
170
-
171
-
172
-
173
-
174
-
175
-
176
-
177
-
178
-
179
-
180
-
181
-
182
-
183
-
184
-
185
-
186
 |
 |

75
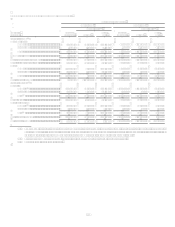
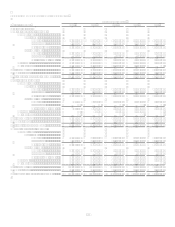
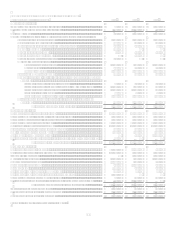
TABLE CMANAGED LOAN PORTFOLIO
Year Ended December 31
(Dollars in thousands) 2008
2007
2006
2005
2004
Year-End Balances:
Reported loans held for investment:
Consumer loans........................................
Credit cards ...................................
Domestic ............................. $ 16,954,281
$ 13,130,866 $ 18,102,140 $ 16,389,054 $ 16,536,789
International........................ 2,873,764
3,661,661 3,203,148 3,356,415 4,017,585
Total credit card .................. 19,828,045
16,792,527 21,305,288 19,745,469 20,554,374
Installment loans............................
Domestic ............................. 10,130,678
9,966,818 7,057,270 5,763,538 4,475,838
International........................ 119,320
354,556 637,982 551,460 493,846
Total installment loans........ 10,249,998
10,321,374 7,695,252 6,314,998 4,969,684
Auto loans................................................ 21,491,285
25,038,294 23,180,455 18,041,894 9,997,497
Mortgage loans......................................... 10,663,598
12,296,575 12,586,905 5,281,009
Total consumer loans.......................................... 62,232,926
64,448,770 64,767,900 49,383,370 35,521,555
Commercial loans............................................... 38,784,845
37,356,257 31,744,239 10,464,311 2,694,036
Total reported loans held for investment ............ 101,017,771
101,805,027 96,512,139 59,847,681 38,215,591
Securitization adjustments:
Consumer loans........................................
Credit cards ...................................
Domestic ............................. 36,605,663
38,885,887 35,430,763 33,059,990 32,088,151
International........................ 5,727,873
7,645,332 7,906,309 6,740,949 6,023,346
Total credit card .................. 42,333,536
46,531,219 43,337,072 39,800,939 38,111,497
Installment loans............................
Domestic ............................. 935,800
1,968,688 2,899,221 2,621,652 2,163,538
International........................
Total installment loans........ 935,800
1,968,688 2,899,221 2,621,652 2,163,538
Auto loans................................................
110,448 468,823 1,116,761
Mortgage loans.........................................
Total consumer loans.......................................... 43,269,336
48,610,355 46,705,116 43,539,352 40,275,035
Commercial loans............................................... 2,649,647
947,035 2,934,013 2,140,458 1,370,673
Total securitization adjustments ......................... 45,918,983
49,557,390 49,639,129 45,679,810 41,645,708
Managed loans held for investment:
Consumer loans........................................
Credit cards ...................................
Domestic ............................. 53,559,944
52,016,753 53,532,903 49,449,044 48,624,940
International........................ 8,601,637
11,306,993 11,109,457 10,097,364 10,040,931
Total credit card .................. 62,161,581
63,323,746 64,642,360 59,546,408 58,665,871
Installment loans............................
Domestic ............................. 11,066,478
11,935,506 9,956,491 8,385,190 6,639,376
International........................ 119,320
354,556 637,982 551,460 493,846
Total installment loans........ 11,185,798
12,290,062 10,594,473 8,936,650 7,133,222
Auto loans................................................ 21,491,285
25,148,742 23,649,278 19,158,655 9,997,497
Mortgage loans......................................... 10,663,598
12,296,575 12,586,905 5,281,009
Total consumer loans.......................................... 105,502,262
113,059,125 111,473,016 92,922,722 75,796,590
Commercial loans............................................... 41,434,492
38,303,292 34,678,252 12,604,769 4,064,709
Total managed loans held for investment ........... $ 146,936,754
$ 151,362,417 $ 146,151,268 $ 105,527,491 $ 79,861,299