Capital One 2008 Annual Report Download - page 174
Download and view the complete annual report
Please find page 174 of the 2008 Capital One annual report below. You can navigate through the pages in the report by either clicking on the pages listed below, or by using the keyword search tool below to find specific information within the annual report.-
 1
1 -
2
-
3
-
4
-
5
-
6
-
7
-
8
-
9
-
10
-
11
-
12
-
13
-
14
-
15
-
16
-
17
-
18
-
19
-
20
-
21
-
22
-
23
-
24
-
25
-
26
-
27
-
28
-
29
-
30
-
31
-
32
-
33
-
34
-
35
-
36
-
37
-
38
-
39
-
40
-
41
-
42
-
43
-
44
-
45
-
46
-
47
-
48
-
49
-
50
-
51
-
52
-
53
-
54
-
55
-
56
-
57
-
58
-
59
-
60
-
61
-
62
-
63
-
64
-
65
-
66
-
67
-
68
-
69
-
70
-
71
-
72
-
73
-
74
-
75
-
76
-
77
-
78
-
79
-
80
-
81
-
82
-
83
-
84
-
85
-
86
-
87
-
88
-
89
-
90
-
91
-
92
-
93
-
94
-
95
-
96
-
97
-
98
-
99
-
100
-
101
-
102
-
103
-
104
-
105
-
106
-
107
-
108
-
109
-
110
-
111
-
112
-
113
-
114
-
115
-
116
-
117
-
118
-
119
-
120
-
121
-
122
-
123
-
124
-
125
-
126
-
127
-
128
-
129
-
130
-
131
-
132
-
133
-
134
-
135
-
136
-
137
-
138
-
139
-
140
-
141
-
142
-
143
-
144
-
145
-
146
-
147
-
148
-
149
-
150
-
151
-
152
-
153
-
154
-
155
-
156
-
157
-
158
-
159
-
160
-
161
-
162
-
163
-
 164
164 -
 165
165 -
 166
166 -
 167
167 -
 168
168 -
 169
169 -
 170
170 -
 171
171 -
 172
172 -
 173
173 -
 174
174 -
 175
175 -
 176
176 -
 177
177 -
 178
178 -
 179
179 -
 180
180 -
 181
181 -
 182
182 -
 183
183 -
 184
184 -
185
-
186
 |
 |

156
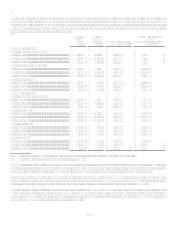
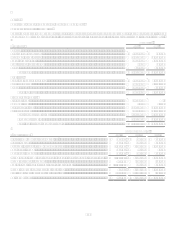
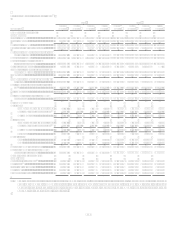
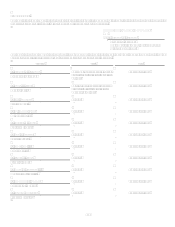
Selected Quarterly Financial Data(1)
2008
2007
(Unaudited)
Fourth
Quarter
Third
Quarter
Second
Quarter
First
Quarter
Fourth(4)
Quarter
Third
Quarter
Second
Quarter
First
Quarter
Summary of Operations:
(In Thousands)
Interest income ............................................ $ 2,768,821 $ 2,771,796 $ 2,691,857 $ 2,879,525 $ 2,960,194 $ 2,766,967 $ 2,638,686 $ 2,712,309
Interest expense ........................................... 966,424 965,151 964,101 1,067,608 1,197,947 1,142,493 1,100,105 1,107,766
Net interest income ...................................... 1,802,397 1,806,645 1,727,756 1,811,917 1,762,247 1,624,474 1,538,581 1,604,543
Provision for loan and lease losses............... 2,098,921 1,093,917 829,130 1,079,072 1,294,210 595,534 396,713 350,045
Net interest income after provision for loan
and lease losses ...................................... (296,524 ) 712,728 898,626 732,845 468,037 1,028,940 1,141,868 1,254,498
Non-interest income..................................... 1,368,286 1,696,891 1,622,316 2,056,478 2,158,340 2,149,662 1,971,851 1,774,370
Non-interest expense, excluding
restructuring expenses............................ 2,705,104 1,794,900 1,806,041 1,769,518 2,107,398 1,914,867 1,943,461 1,974,047
Restructuring expenses ................................ 52,839 15,306 13,560 52,759 27,809 19,354 91,074
Income (loss) from continuing operations
before income taxes................................ (1,686,181 ) 599,413 701,341 967,046 491,170 1,244,381 1,079,184 1,054,821
Income taxes................................................ (289,856 ) 213,624 238,843 334,491 169,558 428,010 311,572 368,697
Income (loss) from continuing operations,
net of tax ................................................ (1,396,325 ) 385,789 462,498 632,555 321,612 816,371 767,612 686,124
Loss from discontinued operations, net of
tax(2)........................................................ (25,221 ) (11,650 ) (9,593 ) (84,051 ) (95,044 ) (898,029 ) (17,240 ) (11,074 )
Net income (loss)......................................... $ (1,421,546 ) $ 374,139 $ 452,905 $ 548,504 $ 226,568 $ (81,658 ) $ 750,372 $ 675,050
Net income (loss) available to common
shareholders ........................................... $ (1,454,269 ) $ 374,139 $ 452,905 $ 548,504 $ 226,568 $ (81,658 ) $ 750,372 $ 675,050
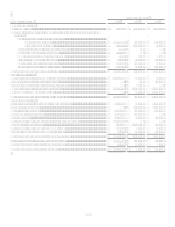
Per Common Share:
Basic EPS:
Income from continuing operations .. $ (3.67 ) $ 1.03 $ 1.24 $ 1.71 $ 0.85 $ 2.11 $ 1.96 $ 1.68
Loss from discontinued operations(2) (0.07 ) (0.03 ) (0.03 ) (0.23 ) (0.25 ) (2.32 ) (0.04 ) (0.03 )
Net Income (loss).............................. $ (3.74 ) $ 1.00 $ 1.21 $ 1.48 $ 0.60 $ (0.21 ) $ 1.92 $ 1.65
Diluted EPS:
Income from continuing operations .. $ (3.67 ) $ 1.03 $ 1.24 $ 1.70 $ 0.85 $ 2.09 $ 1.93 $ 1.65
Loss from discontinued operations(2) (0.07 ) (0.03 ) (0.03 ) (0.23 ) (0.25 ) (2.30 ) (0.04 ) (0.03 )
Net Income (loss).............................. $ (3.74 ) $ 1.00 $ 1.21 $ 1.47 $ 0.60 $ (0.21 ) $ 1.89 $ 1.62
Dividends.......................................... 0.375 0.375 0.375 0.375 0.03 0.03 0.03 0.03
Market prices
High.................................................. 32.34 53.00 39.89 50.19
72.94 78.94 81.85 83.61
Low................................................... 30.74 45.90 37.91 48.00
45.66 62.70 70.26 74.37
Average common shares (000s)................... 389,008 372,928 372,348 370,743 375,566 386,133 390,847 408,709
Average common shares and common
equivalent shares (000s) ......................... 389,008 374,293 373,653 372,272 378,439 390,844 397,473 415,530
Average Balance Sheet Data:
(In Millions)
Loans held for investment(3)......................... $ 99,335 $ 98,778 $ 97,950 $ 99,819 $ 97,785 $ 91,745 $ 91,145 $ 93,466
Total assets(3) ............................................... 161,976 156,958 154,288 149,460 150,926 143,291 142,690 143,130
Interest-bearing deposits .............................. 93,144 84,655 78,675 74,167 72,074 73,338 75,024 74,654
Total deposits............................................... 104,093 95,328 89,522 84,779 83,813 84,667 86,525 86,024
Stockholders equity .................................... $ 26,658 $ 25,046 $ 24,839 $ 24,569 $ 24,733 $ 25,344 $ 25,128 $ 25,610
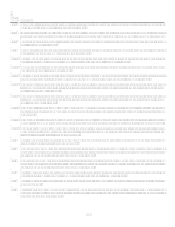
(1) The above schedule is a tabulation of the Companys unaudited quarterly results for the years ended December 31, 2008 and
2007. The Companys common shares are traded on the New York Stock Exchange under the symbol COF. In addition, shares
may be traded in the over-the-counter stock market. There were 17,653 and 18,487 common stockholders of record as of
December 31, 2008 and 2007, respectively.