Capital One 2008 Annual Report Download - page 44
Download and view the complete annual report
Please find page 44 of the 2008 Capital One annual report below. You can navigate through the pages in the report by either clicking on the pages listed below, or by using the keyword search tool below to find specific information within the annual report.-
 1
1 -
2
-
3
-
4
-
5
-
6
-
7
-
8
-
9
-
10
-
11
-
12
-
13
-
14
-
15
-
16
-
17
-
18
-
19
-
20
-
21
-
22
-
23
-
24
-
25
-
26
-
27
-
28
-
29
-
30
-
31
-
32
-
33
-
 34
34 -
 35
35 -
 36
36 -
 37
37 -
 38
38 -
 39
39 -
 40
40 -
 41
41 -
 42
42 -
 43
43 -
 44
44 -
 45
45 -
 46
46 -
 47
47 -
 48
48 -
 49
49 -
 50
50 -
 51
51 -
 52
52 -
 53
53 -
 54
54 -
55
-
56
-
57
-
58
-
59
-
60
-
61
-
62
-
63
-
64
-
65
-
66
-
67
-
68
-
69
-
70
-
71
-
72
-
73
-
74
-
75
-
76
-
77
-
78
-
79
-
80
-
81
-
82
-
83
-
84
-
85
-
86
-
87
-
88
-
89
-
90
-
91
-
92
-
93
-
94
-
95
-
96
-
97
-
98
-
99
-
100
-
101
-
102
-
103
-
104
-
105
-
106
-
107
-
108
-
109
-
110
-
111
-
112
-
113
-
114
-
115
-
116
-
117
-
118
-
119
-
120
-
121
-
122
-
123
-
124
-
125
-
126
-
127
-
128
-
129
-
130
-
131
-
132
-
133
-
134
-
135
-
136
-
137
-
138
-
139
-
140
-
141
-
142
-
143
-
144
-
145
-
146
-
147
-
148
-
149
-
150
-
151
-
152
-
153
-
154
-
155
-
156
-
157
-
158
-
159
-
160
-
161
-
162
-
163
-
164
-
165
-
166
-
167
-
168
-
169
-
170
-
171
-
172
-
173
-
174
-
175
-
176
-
177
-
178
-
179
-
180
-
181
-
182
-
183
-
184
-
185
-
186
 |
 |
26
PART II
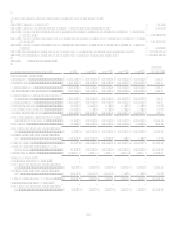
Item 5. Market for Companys Common Equity and Related Stockholder Matters.
(Dollars in thousands, except per share information)
Total Number of
Shares Purchased(1)
Average Price
Paid per Share
Total Number of
Shares Purchased
as Part of
Publicly
Announced Plans(1)
Maximum Amount
That May Yet be
Purchased Under
the Plan or
Program(1)
October 1-31, 2008 ......................................................
.
3,261 $ 48.78 0 $ 2,000,000
November 1-30, 2008 ..................................................
.
1,329 31.82 0 $ 2,000,000
December 1-31, 2008...................................................
.
10,738 29.87 0 $ 2,000,000
Total.............................................................................
.
15,328 0
(1) Shares purchased represent shares purchased and share swaps made in connection with stock option exercises and the
withholding of shares to cover taxes on restricted stock lapses. The stock repurchase program is intended to comply with Rules
10b5-1(c) (1) (i) and 10b-18 of the Securities Exchange Act of 1934, as amended. See note 10 for additional information.
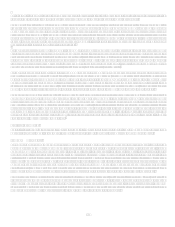
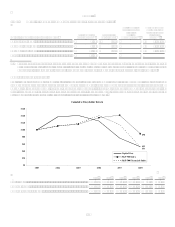
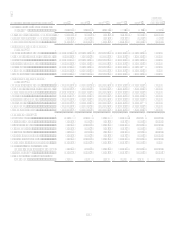
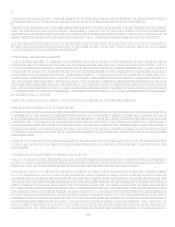
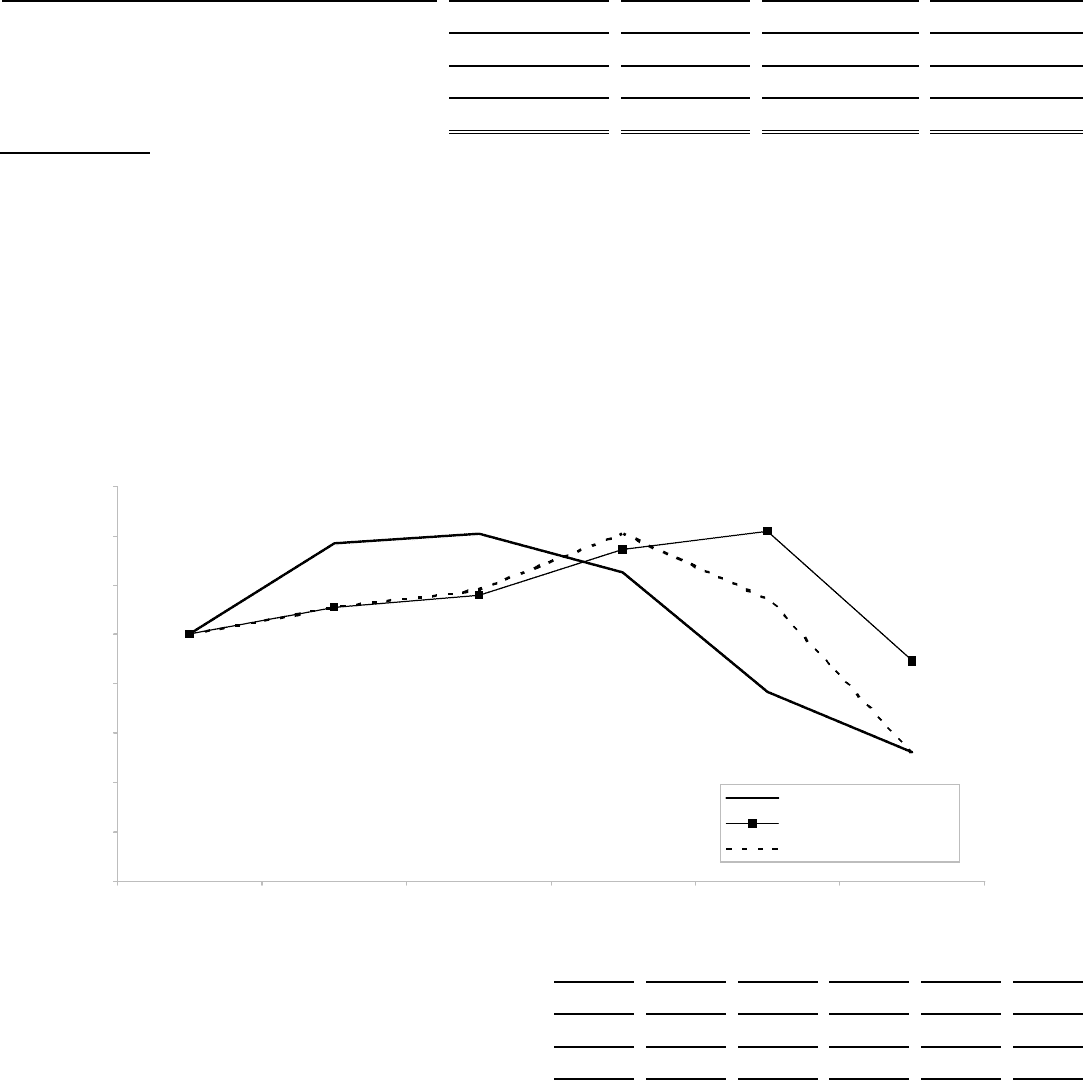
Cumulative Shareholder Return
The following graph compares cumulative total stockholder return on our common stock with the S&P Composite 500 Stock Index
(S&P 500 Index) and an industry index, the S&P Financial Composite Index (S&P 500 Financials Index), for the period from
December 31, 2003 to December 31, 2008. The graph assumes an initial investment of $100 in common stock of the specified
securities. The cumulative returns include stock price appreciation and assume full reinvestment of dividends. The stock price
performance on the graph below is not necessarily indicative of future performance.
2003
2004
2005
2006
2007
2008
Capital One .......................................................................................
.
100.00 137.40 140.97 125.34 77.11 52.03
S&P 500 Index..................................................................................
.
100.00 110.88 116.32 134.69 142.09 89.52
S&P 500 Financials Index ................................................................
.
100.00 110.91 118.03 140.68 114.47 51.15
Cumulative Shareholder Return
$52
$90
$51
$0
$20
$40
$60
$80
$100
$120
$140
$160
2003 2004 2005 2006 2007 2008
Capital One
S&P 500 Inde x
S&P 500 Financials Inde x