Capital One 2008 Annual Report Download - page 71
Download and view the complete annual report
Please find page 71 of the 2008 Capital One annual report below. You can navigate through the pages in the report by either clicking on the pages listed below, or by using the keyword search tool below to find specific information within the annual report.-
 1
1 -
2
-
3
-
4
-
5
-
6
-
7
-
8
-
9
-
10
-
11
-
12
-
13
-
14
-
15
-
16
-
17
-
18
-
19
-
20
-
21
-
22
-
23
-
24
-
25
-
26
-
27
-
28
-
29
-
30
-
31
-
32
-
33
-
34
-
35
-
36
-
37
-
38
-
39
-
40
-
41
-
42
-
43
-
44
-
45
-
46
-
47
-
48
-
49
-
50
-
51
-
52
-
53
-
54
-
55
-
56
-
57
-
58
-
59
-
60
-
 61
61 -
 62
62 -
 63
63 -
 64
64 -
 65
65 -
 66
66 -
 67
67 -
 68
68 -
 69
69 -
 70
70 -
 71
71 -
 72
72 -
 73
73 -
 74
74 -
 75
75 -
 76
76 -
 77
77 -
 78
78 -
 79
79 -
 80
80 -
 81
81 -
82
-
83
-
84
-
85
-
86
-
87
-
88
-
89
-
90
-
91
-
92
-
93
-
94
-
95
-
96
-
97
-
98
-
99
-
100
-
101
-
102
-
103
-
104
-
105
-
106
-
107
-
108
-
109
-
110
-
111
-
112
-
113
-
114
-
115
-
116
-
117
-
118
-
119
-
120
-
121
-
122
-
123
-
124
-
125
-
126
-
127
-
128
-
129
-
130
-
131
-
132
-
133
-
134
-
135
-
136
-
137
-
138
-
139
-
140
-
141
-
142
-
143
-
144
-
145
-
146
-
147
-
148
-
149
-
150
-
151
-
152
-
153
-
154
-
155
-
156
-
157
-
158
-
159
-
160
-
161
-
162
-
163
-
164
-
165
-
166
-
167
-
168
-
169
-
170
-
171
-
172
-
173
-
174
-
175
-
176
-
177
-
178
-
179
-
180
-
181
-
182
-
183
-
184
-
185
-
186
 |
 |

53
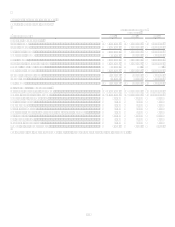
As of and for the Year ended
December 31
(Dollars in thousands)
2008
2007
2006
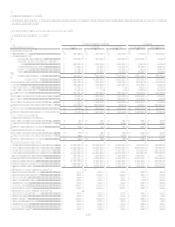
Non performing loans as a % of loans held for investment ................................................................. 1.25% 0.40% 0.48%
Non performing asset rates (12)
Commercial lending
Commercial and multi-family real estate ................................................................................... 1.20% 0.24% 1.52%
Middle market ............................................................................................................................ 0.43% 0.41% 0.33%
Small ticket commercial real estate............................................................................................ 6.67% 0.54% 0.00%
Specialty lending ........................................................................................................................ 1.05% 0.18% 0.00%
Total commercial lending ................................................................................................. 1.40% 0.32% 0.57%
Small business lending ............................................................................................................... 1.79% 1.06% 0.90%
Consumer lending
Mortgages................................................................................................................................... 1.55% 0.54% 0.90%
Branch based home equity & other consumer............................................................................ 0.46% 0.30% 0.21%
Total consumer lending .................................................................................................... 1.18% 0.46% 0.28%
Total non performing asset rate ........................................................................................................... 1.39% 0.44% 0.57%
Non-interest expense as a % of average loans held for investment ..................................................... 5.51% 5.52% 10.46%
Number of active ATMs ...................................................................................................................... 1,311 1,288 661
Number of locations............................................................................................................................. 739 742 358
(1) Core deposits includes domestic non-interest bearing deposits, NOW accounts, money market deposit accounts, savings
accounts, certificates of deposit of less than $100,000 and other consumer time deposits.
(2) Net interest marginloans equals net interest incomeloans divided by average managed loans.
(3) Net interest margindeposits equals net interest deposits divided by average retail deposits.
(4) Commercial and multi-family real estate targets private developers and commercial property investors and owners with credit
requirements up to $100 million.
(5) Middle market focuses on businesses with annual revenues between $10 million and $250 million located within the segments
local footprint.
(6) Small ticket commercial real estate is comprised of small business products, mainly mixed-use and multi-family real-estate in
the Local Banking segment.
(7) Specialty lending provides equipment leasing and other specialized lending in the national marketplace.
(8) Small business lending is focused on businesses with $10 million or less in revenues and $3 million or less in household size.
(9) Mortgage lending includes held for investment first lien residential mortgage assets.
(10) Branch based home equity and other consumer lending primarily includes home equity loans and lines of credit in the local
consumer banking segment, and some consumer unsecured loans and lines of credit.
(11) Other loans held for investment includes unamortized premiums and discounts recognized on loans acquired in North Fork and
Hibernia acquisitions, certain items in process, and other loans originated by the Local Banking segment.
(12) Non performing assets is comprised of non performing loans and foreclosed assets. The non performing asset rate equals non
performing assets divided by the sum of loans held for investment plus foreclosed assets.
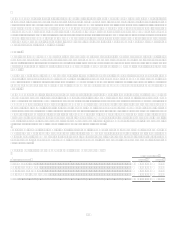
The Local Banking segment includes the Companys branch, treasury services and national deposit gathering activities; its
commercial, branch based small business and certain branch originated consumer lending; and its mortgage servicing.
Beginning in 2006, we added a Local Banking segment. The Local Banking segment represents the results of the legacy Hibernia and
North Fork business lines, except for the indirect auto business and the investment portfolio results. The legacy indirect auto
businesses of both Hibernia and North Fork are included in the Auto Finance sub-segment results, and the respective investment
portfolio results are included in the Other segment. The impacts of the North Fork acquisition for the year ended December 31, 2006
are included in the Other segment.