Capital One 2008 Annual Report Download - page 45
Download and view the complete annual report
Please find page 45 of the 2008 Capital One annual report below. You can navigate through the pages in the report by either clicking on the pages listed below, or by using the keyword search tool below to find specific information within the annual report.-
 1
1 -
2
-
3
-
4
-
5
-
6
-
7
-
8
-
9
-
10
-
11
-
12
-
13
-
14
-
15
-
16
-
17
-
18
-
19
-
20
-
21
-
22
-
23
-
24
-
25
-
26
-
27
-
28
-
29
-
30
-
31
-
32
-
33
-
34
-
 35
35 -
 36
36 -
 37
37 -
 38
38 -
 39
39 -
 40
40 -
 41
41 -
 42
42 -
 43
43 -
 44
44 -
 45
45 -
 46
46 -
 47
47 -
 48
48 -
 49
49 -
 50
50 -
 51
51 -
 52
52 -
 53
53 -
 54
54 -
 55
55 -
56
-
57
-
58
-
59
-
60
-
61
-
62
-
63
-
64
-
65
-
66
-
67
-
68
-
69
-
70
-
71
-
72
-
73
-
74
-
75
-
76
-
77
-
78
-
79
-
80
-
81
-
82
-
83
-
84
-
85
-
86
-
87
-
88
-
89
-
90
-
91
-
92
-
93
-
94
-
95
-
96
-
97
-
98
-
99
-
100
-
101
-
102
-
103
-
104
-
105
-
106
-
107
-
108
-
109
-
110
-
111
-
112
-
113
-
114
-
115
-
116
-
117
-
118
-
119
-
120
-
121
-
122
-
123
-
124
-
125
-
126
-
127
-
128
-
129
-
130
-
131
-
132
-
133
-
134
-
135
-
136
-
137
-
138
-
139
-
140
-
141
-
142
-
143
-
144
-
145
-
146
-
147
-
148
-
149
-
150
-
151
-
152
-
153
-
154
-
155
-
156
-
157
-
158
-
159
-
160
-
161
-
162
-
163
-
164
-
165
-
166
-
167
-
168
-
169
-
170
-
171
-
172
-
173
-
174
-
175
-
176
-
177
-
178
-
179
-
180
-
181
-
182
-
183
-
184
-
185
-
186
 |
 |

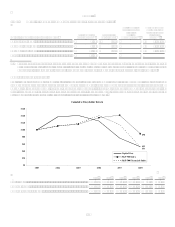
27
The remaining information required by Item 5 is included under the following:
Item 1 BusinessOverview Page 3
Item 1 BusinessSupervision and RegulationDividends and Transfers of Funds Page 12
Item 7 Managements Discussion and Analysis of Financial Condition and Results of OperationsMarket Ris
k
Management Pages 68-70
Item 7 Managements Discussion and Analysis of Financial Condition and Results of OperationsCapital
Adequacy Pages 70-72
Item 7 Managements Discussion and Analysis of Financial Condition and Results of OperationsDividen
d
Policy Page 72
Item 8 Financial Statements and Supplementary DataNotes to the Consolidated Financial Statements Pages 85-151
Item 8 Financial Statements and Supplementary DataSelected Quarterly Financial Data Page 155-156
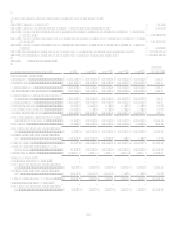
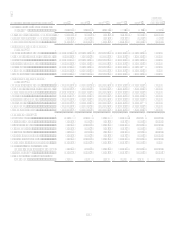
Item 6. Selected Financial Data
(Dollars in millions, Except Per Share Data)
2008
2007 (1)
2006(1)(5)
2005(1)(4)
2004 (1)
Five Year
Compound
Growth Rate
Income Statement Data:
Interest income..............................................
.
$ 11,112.0 $ 11,078.1 $ 8,164.7 $ 5,726.9 $ 4,794.4 18.31%
Interest expense.............................................
.
3,963.3 4,548.3 3,073.3 2,046.6 1,791.4 17.21%
Net interest income .......................................
.
7,148.7 6,529.8 5,091.4 3,680.3 3,003.0 18.94%
Provision for loan and lease losses ...............
.
5,101.0 2,636.5 1,476.4 1,491.1 1,220.9 33.11%
Net interest income after provision for loan
and lease losses ........................................
.
2,047.7 3,893.3 3,615.0 2,189.2 1,782.1 2.82%
Non-interest income......................................
.
6,744.0 8,054.2 7,001.0 6,358.1 5,900.2 2.71%
Restructuring expense...................................
.
134.5 138.2 N/A
Goodwill impairment charge ........................
.
810.9 N/A
Other non-interest expense ...........................
.
7,264.7 7,939.8 6,943.6 5,718.3 5,322.2 6.42%
Income before income taxes and cumulative
effect of accounting change......................
.
581.6 3,869.5 3,672.4 2,829.0 2,360.1 (24.43)%
Income taxes .................................................
.
497.1 1,277.8 1,246.0 1,019.9 816.6 (9.45)%
Income from continuing operations, net of
tax.............................................................
.
$ 84.5 $ 2,591.7 $ 2,426.4 $ 1,809.1 $ 1,543.5 (44.07)%
Loss from discontinued operations, net of
tax(6) ..........................................................
.
(130.5) (1,021.4) (11.9) N/A
Net income (loss)..........................................
.
$ (46.0) $ 1,570.3 $ 2,414.5 $ 1,809.1 $ 1,543.5 (149.53)%
Net income (loss) available to common
shareholders .............................................
.
(78.7) 1,570.3 2,414.5 1,809.1 1,543.5 (155.14)%
Dividend payout ratio ...................................
.
722.06% 2.68% 1.34% 1.52% 1.66% 236.91%
Per Common Share:
Basic earnings per common share:
Income from continuing operations, net of
tax.............................................................
.
$ 0.14 $ 6.64 $ 7.84 $ 6.98 $ 6.55 (53.66)%
Loss from discontinued operations, net of
tax(6) ..........................................................
.
(0.35) (2.62) (0.04) N/A
Net income (loss) per common share............
.
$ (0.21) $ 4.02 $ 7.80 $ 6.98 $ 6.55 (150.26)%
Diluted earnings per common share:
Income from continuing operations, net of
tax.............................................................
.
$ 0.14 $ 6.55 $ 7.65 $ 6.73 $ 6.21 (150.80)%