Capital One 2008 Annual Report Download - page 66
Download and view the complete annual report
Please find page 66 of the 2008 Capital One annual report below. You can navigate through the pages in the report by either clicking on the pages listed below, or by using the keyword search tool below to find specific information within the annual report. 48
Servicing and Securitizations Income
Servicing and securitizations income represents servicing fees, excess spread and other fees derived from the off-balance sheet
loan portfolio, adjustments to the fair value of retained interests derived through securitization transactions, as well as gains and
losses resulting from securitization and other sales transactions.
Servicing and securitizations income decreased 30% for the year ended December 31, 2008. The decrease was attributable to
reductions in average securitized loans year over year and to reductions in fair value of the interest-only strips of $224.8 million
due to the worsening global credit environment. Average securitized loans were $48.8 billion for 2008 compared to $51.2
billion for 2007.
Servicing and securitizations income increased 15% for the year ended December 31, 2007. This increase was attributable to
higher net gains on sales resulting from higher revenue generated from selective pricing and fee changes in the U.S. card
portfolio offset somewhat by higher charge-offs in the securitized portfolio resulting from continued normalization of credit
losses and a 7% increase in average securitized loans year over year. Average securitized loans were $51.2 billion for 2007
compared to $47.8 billion in 2006.
Service Charges and Other Customer-Related Fees
For 2008, service charges and other customer-related fees grew 8% due to higher overlimit and cash advance fees.
For 2007, service charges and other customer-related fees grew 16% due to the inclusion of North Fork and selective pricing
changes in the U.S. Card sub-segment.
Mortgage Servicing and Other Income
Mortgage servicing and other income is comprised of non-interest income related to our mortgage servicing business and other
mortgage related income. For the year ended December 31, 2008, mortgage servicing and other income decreased 37% from the
prior year due to the changes in fair value of the mortgage servicing rights attributable to the run-off of the portfolio and reduced
gains on sales due to lower originations in 2008.
For the year ended December 31, 2007, mortgage servicing and other income decreased 6% from prior year due to the changes
in fair value of the mortgage servicing rights attributable to the run-off of the portfolio and lack of originations subsequent to the
shutdown of GreenPoints mortgage origination business in 2007.
Interchange
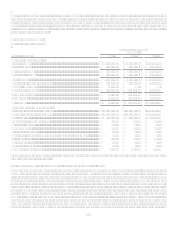
Interchange income, net of rewards expense, increased 12.3% for the year ended December 31, 2008 on a reported basis due to a
shift in loans from a reduction in our off-balance sheet securitized loans to an increase in our reported on-balance sheet loans
during 2008. Interchange on a managed basis decreased 7.8% due to decreases in managed purchase volume of 1.2% and
increases in rewards expense. Costs associated with the Companys rewards programs in 2008 were $221.4 million on a
reported basis and $709.2 million on a managed basis. The increase in the rewards expense was due to an expansion of our
rewards programs.
Interchange income, net of rewards expense, decreased 9% for the year ended December 31, 2007 due to decreases in reported
purchase volume of 3% and higher costs associated with our rewards programs of 3%. Managed U.S. Card purchase volume
increased 3% compared to 2006. Costs associated with the Companys rewards programs in 2007 were $182.9 million on a
reported basis and $602.2 million on a managed basis.
Other Non-Interest Income
Other non-interest income includes, among other items, gains and losses on sales of securities, gains and losses associated with
hedging transactions and revenue generated by our healthcare finance business.
Other non-interest income for the year ended December 31, 2008 decreased $28.4 million or 5.8%. The decrease was primarily
due to reduced commission income and changes in exchange rates from 2007. Other non-interest income for 2008 also includes
a $109.0 million gain from the redemption of shares related to the Visa IPO and a gain of $44.9 million from the sale of
MasterCard stock.
Other non-interest income for the year ended December 31, 2007 increased $194.4 million or 66%. The increase is primarily
due to the North Fork acquisition. Other non-interest income for 2007 also includes a $46.2 million gain from the sale of a stake
in DealerTrack Holding Inc., a $41.6 million gain on sale of our interest in a relationship agreement to develop and market
consumer credit products in Spain and gains from sales of MasterCard stock of $43.4 million.


