Capital One 2008 Annual Report Download - page 119
Download and view the complete annual report
Please find page 119 of the 2008 Capital One annual report below. You can navigate through the pages in the report by either clicking on the pages listed below, or by using the keyword search tool below to find specific information within the annual report.-
 1
1 -
2
-
3
-
4
-
5
-
6
-
7
-
8
-
9
-
10
-
11
-
12
-
13
-
14
-
15
-
16
-
17
-
18
-
19
-
20
-
21
-
22
-
23
-
24
-
25
-
26
-
27
-
28
-
29
-
30
-
31
-
32
-
33
-
34
-
35
-
36
-
37
-
38
-
39
-
40
-
41
-
42
-
43
-
44
-
45
-
46
-
47
-
48
-
49
-
50
-
51
-
52
-
53
-
54
-
55
-
56
-
57
-
58
-
59
-
60
-
61
-
62
-
63
-
64
-
65
-
66
-
67
-
68
-
69
-
70
-
71
-
72
-
73
-
74
-
75
-
76
-
77
-
78
-
79
-
80
-
81
-
82
-
83
-
84
-
85
-
86
-
87
-
88
-
89
-
90
-
91
-
92
-
93
-
94
-
95
-
96
-
97
-
98
-
99
-
100
-
101
-
102
-
103
-
104
-
105
-
106
-
107
-
108
-
 109
109 -
 110
110 -
 111
111 -
 112
112 -
 113
113 -
 114
114 -
 115
115 -
 116
116 -
 117
117 -
 118
118 -
 119
119 -
 120
120 -
 121
121 -
 122
122 -
 123
123 -
 124
124 -
 125
125 -
 126
126 -
 127
127 -
 128
128 -
 129
129 -
130
-
131
-
132
-
133
-
134
-
135
-
136
-
137
-
138
-
139
-
140
-
141
-
142
-
143
-
144
-
145
-
146
-
147
-
148
-
149
-
150
-
151
-
152
-
153
-
154
-
155
-
156
-
157
-
158
-
159
-
160
-
161
-
162
-
163
-
164
-
165
-
166
-
167
-
168
-
169
-
170
-
171
-
172
-
173
-
174
-
175
-
176
-
177
-
178
-
179
-
180
-
181
-
182
-
183
-
184
-
185
-
186
 |
 |

101
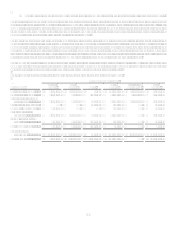
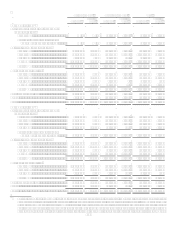
Note 4
Securities Available for Sale
Securities available-for-sale, aggregated by investment category, and based on expected maturities as of December 31, 2008, 2007,
and 2006 were as follows:
Expected Maturity Schedule(1)
1 Year
or Less
15
Years
510
Years
Over 10
Years
Market
Value
Totals
Amortized
Cost Totals
December 31, 2008
U.S. Treasury and other U.S.
government agency obligations(2)
U.S. Treasury......................................
.
$ 40,751 $ 181,925 $ $ $ 222,676 $ 201,305
Fannie Mae.........................................
.
86,584 245,427 332,011 316,749
Freddie Mac........................................
.
30,097 109,219 139,316 130,570
Other GSE and FDIC Debt
Guaranteed Program (DGP).......
.
265,733 650,593 916,326 900,499
Total U.S. Treasury and other U.S.
Government agency obligations ....
.
423,165 1,187,164 1,610,329 1,549,123
Collateralized mortgage obligations
(CMO)
Fannie Mae.........................................
.
836,826 2,830,452 78,555 3,745,833 3,711,950
Freddie Mac........................................
.
467,790 4,745,804 5,213,594 5,161,772
Other GSE ..........................................
.
63,168 153,712 216,880 211,767
Non GSE ............................................
.
167,221 1,750,758 730 7,209 1,925,918 2,530,224
Total CMO .........................................
.
1,535,005 9,480,726 79,285 7,209 11,102,225 11,615,713
Mortgage backed securities (MBS)
Fannie Mae.........................................
.
29,206 7,651,869 18,976 7,700,051 7,618,060
Freddie Mac........................................
.
80,504 4,619,503 1,295 4,701,302 4,670,441
Other GSE ..........................................
.
617 487,683 488,300 474,854
Non GSE ............................................
.
40,118 783,098 823,216 1,254,152
Total MBS..........................................
.
150,445 13,542,153 20,271 13,712,869 14,017,507
Asset backed securities ................................
.
1,508,087 2,369,443 218,527 4,096,057 4,433,428
Other ............................................................
.
162,975 128,267 44,566 145,983 481,791 495,860
Total.............................................................
.
$ 3,779,677 $ 26,707,753 $ 362,649 $ 153,192 $ 31,003,271 $ 32,111,631
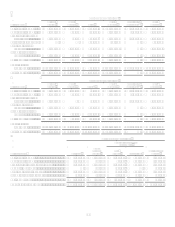
December 31, 2007(1)
U.S. Treasury and other U.S. government
agency obligations
U.S. Treasury......................................
.
$ 30,495 $ 88,300 $ 118,810 $ $ 237,605 $ 232,242
Fannie Mae.........................................
.
205,211 326,311 531,522 525,632
Freddie Mac........................................
.
149,542 84,820 102,125 336,487 334,958
Other GSE ..........................................
.
159,573 120,077 1,039 280,689 277,005
Total U.S. Treasury and other U.S.
Government agency obligations ....
.
544,821 619,508 221,974 1,386,303 1,369,837
Collateralized mortgage obligations
Fannie Mae.........................................
.
7,444 1,697,318 96,900 1,801,662 1,798,157
Freddie Mac........................................
.
25,022 3,625,163 314,032 3,964,217 3,960,157
Other GSE ..........................................
.
177,708 177,708 177,738