Capital One 2008 Annual Report Download - page 122
Download and view the complete annual report
Please find page 122 of the 2008 Capital One annual report below. You can navigate through the pages in the report by either clicking on the pages listed below, or by using the keyword search tool below to find specific information within the annual report.-
 1
1 -
2
-
3
-
4
-
5
-
6
-
7
-
8
-
9
-
10
-
11
-
12
-
13
-
14
-
15
-
16
-
17
-
18
-
19
-
20
-
21
-
22
-
23
-
24
-
25
-
26
-
27
-
28
-
29
-
30
-
31
-
32
-
33
-
34
-
35
-
36
-
37
-
38
-
39
-
40
-
41
-
42
-
43
-
44
-
45
-
46
-
47
-
48
-
49
-
50
-
51
-
52
-
53
-
54
-
55
-
56
-
57
-
58
-
59
-
60
-
61
-
62
-
63
-
64
-
65
-
66
-
67
-
68
-
69
-
70
-
71
-
72
-
73
-
74
-
75
-
76
-
77
-
78
-
79
-
80
-
81
-
82
-
83
-
84
-
85
-
86
-
87
-
88
-
89
-
90
-
91
-
92
-
93
-
94
-
95
-
96
-
97
-
98
-
99
-
100
-
101
-
102
-
103
-
104
-
105
-
106
-
107
-
108
-
109
-
110
-
111
-
 112
112 -
 113
113 -
 114
114 -
 115
115 -
 116
116 -
 117
117 -
 118
118 -
 119
119 -
 120
120 -
 121
121 -
 122
122 -
 123
123 -
 124
124 -
 125
125 -
 126
126 -
 127
127 -
 128
128 -
 129
129 -
 130
130 -
 131
131 -
 132
132 -
133
-
134
-
135
-
136
-
137
-
138
-
139
-
140
-
141
-
142
-
143
-
144
-
145
-
146
-
147
-
148
-
149
-
150
-
151
-
152
-
153
-
154
-
155
-
156
-
157
-
158
-
159
-
160
-
161
-
162
-
163
-
164
-
165
-
166
-
167
-
168
-
169
-
170
-
171
-
172
-
173
-
174
-
175
-
176
-
177
-
178
-
179
-
180
-
181
-
182
-
183
-
184
-
185
-
186
 |
 |

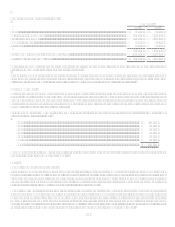
104
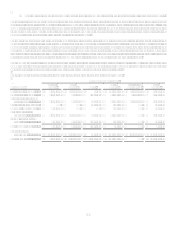
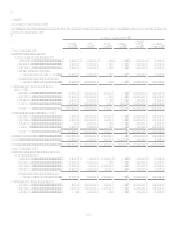
Less than 12 Months
Greater than 12 Months
Total
Fair Value
Unrealized
Losses
Fair Value
Unrealized
Losses
Fair Value
Unrealized
Losses
December 31, 2007(1)
U.S. Treasury and other U.S. government
agency obligations
Freddie Mac...............................................$ $ $ 74,509 $ 1,614 $ 74,509 $ 1,614
Total U.S. Treasury and other U.S.
government agency obligations ............ 74,509 1,614
74,509 1,614
Collateralized mortgage obligations
Fannie Mae................................................ 435,748 2,117 249,805 5,519 685,553 7,636
Freddie Mac............................................... 659,394 6,076 903,774 14,219
1,563,168 20,295
Other GSE ................................................. 12,073 80 17,246 435
29,319 515
Non GSE ................................................... 1,241,739 7,328 376,222 8,452
1,617,961 15,780
Total CMO ................................................ 2,348,954 15,601 1,547,047 28,625 3,896,001 44,226
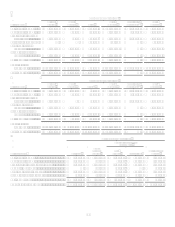
Mortgage backed securities
Fannie Mae................................................ 286,778 575 415,219 8,709 701,997 9,284
Freddie Mac............................................... 708,329 8,253 291,447 7,784
999,776 16,037
Other GSE ................................................. 49,715 258 2,010 5
51,725 263
Non GSE ................................................... 598,677 5,955 52,761 43
651,438 5,998
Total MBS................................................. 1,643,499 15,041 761,437 16,541 2,404,936 31,582
Asset backed securities ....................................... 569,440 5,702 411,997 5,259 981,437 10,961
Other ................................................................... 59,750 1,599 182,422 6,518
242,172 8,117
Total....................................................................$ 4,621,643 $ 37,943 $ 2,977,412 $ 58,557 $ 7,599,055 $ 96,500
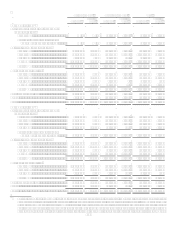
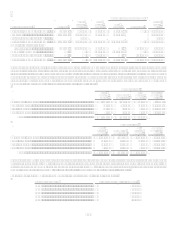
December 31, 2006(1)
U.S. Treasury and other U.S. government
agency obligations
U.S. Treasury.............................................$ 53,965 $ 298 $ 173,192 $ 4,843 $ 227,157 $ 5,141
Fannie Mae................................................ 203,878 203 594,273 7,318
798,151 7,521
Freddie Mac............................................... 189,544 566 371,783 9,126
561,327 9,692
Other GSE ................................................. 212,225 1,380 66,387 540
278,612 1,920
Total U.S. Treasury and other U.S.
government agency obligations ............ 659,612 2,447 1,205,635 21,827
1,865,247 24,274
Collateralized mortgage obligations
Fannie Mae................................................ 897,476 4,067 339,487 11,790 1,236,963 15,857
Freddie Mac............................................... 1,771,406 11,208 1,283,738 32,836
3,055,144 44,044
Other GSE ................................................. 190,424 439 25,035 2,191
215,459 2,630
Non GSE ................................................... 448,559 2,714 352,944 13,510
801,503 16,224
Total CMO ................................................ 3,307,865 18,428 2,001,204 60,327 5,309,069 78,755
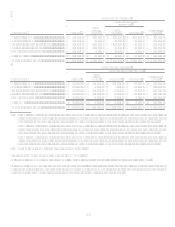
Mortgage backed securities
Fannie Mae................................................ 1,099,100 5,149 636,219 18,953 1,735,319 24,102
Freddie Mac............................................... 353,428 2,019 341,669 15,441
695,097 17,460
Other GSE ................................................. 67,316 545 6,703 170
74,019 715
Total MBS................................................. 1,519,844 7,713 984,591 34,564 2,504,435 42,277
Asset backed securities ....................................... 248,271 1,499 466,765 9,871 715,036 11,370
Other ................................................................... 621,320 1,889 15,393 242
636,713 2,131
Total....................................................................$ 6,356,912 $ 31,976 $ 4,673,588 $ 126,831 $ 11,030,500 $ 158,807
(1) Certain information at December 31, 2007, and 2006 has been revised in these tables from the versions that appeared in prior
10-Ks to correct the classification of securities in an unrealized loss position and to reclassify securities among investment
categories and make certain other immaterial revisions. Fair values and gross losses for investments in an unrealized loss
position have been classified based on the period of time the investments have been in an unrealized loss position rather than
based on contractual maturity. This revision resulted in fewer investments in an unrealized loss position greater than 12 months