Capital One 2008 Annual Report Download - page 92
Download and view the complete annual report
Please find page 92 of the 2008 Capital One annual report below. You can navigate through the pages in the report by either clicking on the pages listed below, or by using the keyword search tool below to find specific information within the annual report.-
 1
1 -
2
-
3
-
4
-
5
-
6
-
7
-
8
-
9
-
10
-
11
-
12
-
13
-
14
-
15
-
16
-
17
-
18
-
19
-
20
-
21
-
22
-
23
-
24
-
25
-
26
-
27
-
28
-
29
-
30
-
31
-
32
-
33
-
34
-
35
-
36
-
37
-
38
-
39
-
40
-
41
-
42
-
43
-
44
-
45
-
46
-
47
-
48
-
49
-
50
-
51
-
52
-
53
-
54
-
55
-
56
-
57
-
58
-
59
-
60
-
61
-
62
-
63
-
64
-
65
-
66
-
67
-
68
-
69
-
70
-
71
-
72
-
73
-
74
-
75
-
76
-
77
-
78
-
79
-
80
-
81
-
 82
82 -
 83
83 -
 84
84 -
 85
85 -
 86
86 -
 87
87 -
 88
88 -
 89
89 -
 90
90 -
 91
91 -
 92
92 -
 93
93 -
 94
94 -
 95
95 -
 96
96 -
 97
97 -
 98
98 -
 99
99 -
 100
100 -
 101
101 -
 102
102 -
103
-
104
-
105
-
106
-
107
-
108
-
109
-
110
-
111
-
112
-
113
-
114
-
115
-
116
-
117
-
118
-
119
-
120
-
121
-
122
-
123
-
124
-
125
-
126
-
127
-
128
-
129
-
130
-
131
-
132
-
133
-
134
-
135
-
136
-
137
-
138
-
139
-
140
-
141
-
142
-
143
-
144
-
145
-
146
-
147
-
148
-
149
-
150
-
151
-
152
-
153
-
154
-
155
-
156
-
157
-
158
-
159
-
160
-
161
-
162
-
163
-
164
-
165
-
166
-
167
-
168
-
169
-
170
-
171
-
172
-
173
-
174
-
175
-
176
-
177
-
178
-
179
-
180
-
181
-
182
-
183
-
184
-
185
-
186
 |
 |

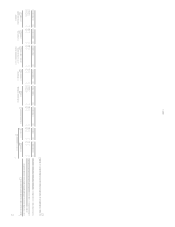
74
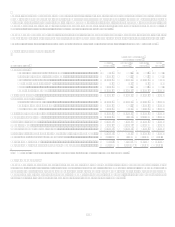
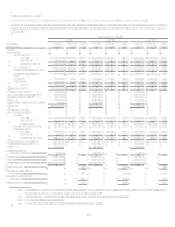
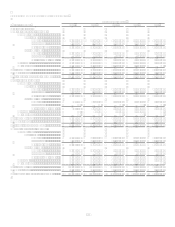
TABLE BINTEREST VARIANCE ANALYSIS
Year Ended December 31
2008 vs. 2007
2007 vs. 2006
Change due to(1)
Change due to(1)
(Dollars in
thousands)
Increase
(Decrease)
Volume
Yield/
Rate
Increase
(Decrease)
Volume
Yield/
Rate
Interest Income(3):
Consumer loans
Domestic.....................................................
.
$ (70,286) $ 139,786 $ (210,072) $ 614,854 $ 1,090,917 $ (476,063)
International................................................
.
8,323 (3,721) 12,044 3,242 (43,978) 47,220
Total ...........................................................
.
(61,963) 137,170 (199,133) 618,096 1,046,777 (428,681)
Commercial loans ..................................................
.
22,213 294,129 (271,916) 1,835,559 1,459,954 375,605
Total loans held for investment..............................
.
(39,750) 535,272 (575,022) 2,453,655 3,085,095 (631,440)
Securities available for sale ...................................
.
273,040 299,213 (26,173) 274,260 209,136 65,124
Other
Domestic.....................................................
.
(166,918) 17,014 (183,932) 181,807 230,549 (48,742)
International................................................
.
(32,529) (4,826) (27,703) 3,699 2,122 1,577
Total ...........................................................
.
(199,447) 8,671 (208,118) 185,506 221,064 (35,558)
Total interest income .............................................
.
33,843 1,016,186 (982,343) 2,913,421 3,432,439 (519,018)
Interest Expense(3):
Deposits
Domestic(2)..................................................
.
(359,130) 283,278 (642,408) 1,080,676 1,097,466 (16,790)
International................................................
.
(35,181) 45,344 (80,525) 10,878 (580) 11,458
Total(2) ........................................................
.
(394,311) 325,357 (719,668) 1,091,554 1,110,187 (18,633)
Senior notes ...........................................................
.
(132,274) (52,937) (79,337) 165,485 177,401 (11,916)
Other borrowings
Domestic(2)..................................................
.
(56,645) 114,038 (170,683) 213,879 141,852 72,027
International................................................
.
(1,797) (3,959) 2,162 4,104 (241) 4,345
Total(2) ........................................................
.
(58,442) 96,840 (155,282) 217,983 133,633 84,350
Total interest expense ............................................
.
(585,027) 407,879 (992,906) 1,475,022 1,481,092 (6,070)
Net interest income ................................................
.
$ 618,870 $ 626,509 $ (7,639) $ 1,438,399 $ 2,058,620 $ (620,221)
(1) The change in interest due to both volume and rates has been allocated in proportion to the relationship of the absolute
dollar amounts of the change in each. The changes in income and expense are calculated independently for each line in the
table. The totals for the volume and yield/rate columns are not the sum of the individual lines.
(2) Prior period amounts have been reclassified to conform with current period presentation.
(3) Based on continuing operations.