Capital One 2008 Annual Report Download - page 70
Download and view the complete annual report
Please find page 70 of the 2008 Capital One annual report below. You can navigate through the pages in the report by either clicking on the pages listed below, or by using the keyword search tool below to find specific information within the annual report.-
 1
1 -
2
-
3
-
4
-
5
-
6
-
7
-
8
-
9
-
10
-
11
-
12
-
13
-
14
-
15
-
16
-
17
-
18
-
19
-
20
-
21
-
22
-
23
-
24
-
25
-
26
-
27
-
28
-
29
-
30
-
31
-
32
-
33
-
34
-
35
-
36
-
37
-
38
-
39
-
40
-
41
-
42
-
43
-
44
-
45
-
46
-
47
-
48
-
49
-
50
-
51
-
52
-
53
-
54
-
55
-
56
-
57
-
58
-
59
-
 60
60 -
 61
61 -
 62
62 -
 63
63 -
 64
64 -
 65
65 -
 66
66 -
 67
67 -
 68
68 -
 69
69 -
 70
70 -
 71
71 -
 72
72 -
 73
73 -
 74
74 -
 75
75 -
 76
76 -
 77
77 -
 78
78 -
 79
79 -
 80
80 -
81
-
82
-
83
-
84
-
85
-
86
-
87
-
88
-
89
-
90
-
91
-
92
-
93
-
94
-
95
-
96
-
97
-
98
-
99
-
100
-
101
-
102
-
103
-
104
-
105
-
106
-
107
-
108
-
109
-
110
-
111
-
112
-
113
-
114
-
115
-
116
-
117
-
118
-
119
-
120
-
121
-
122
-
123
-
124
-
125
-
126
-
127
-
128
-
129
-
130
-
131
-
132
-
133
-
134
-
135
-
136
-
137
-
138
-
139
-
140
-
141
-
142
-
143
-
144
-
145
-
146
-
147
-
148
-
149
-
150
-
151
-
152
-
153
-
154
-
155
-
156
-
157
-
158
-
159
-
160
-
161
-
162
-
163
-
164
-
165
-
166
-
167
-
168
-
169
-
170
-
171
-
172
-
173
-
174
-
175
-
176
-
177
-
178
-
179
-
180
-
181
-
182
-
183
-
184
-
185
-
186
 |
 |

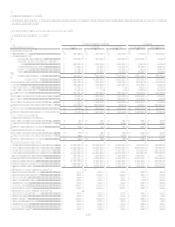
52
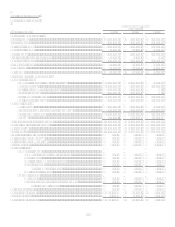
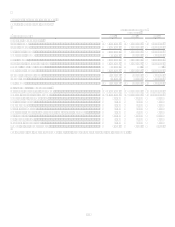
Local Banking Segment
Table 2: Local Banking
As of and for the Year ended
December 31
(Dollars in thousands) 2008
2007
2006
Earnings (Managed Basis)
Interest income.....................................................................................................
.
$ 6,096,293 $ 6,937,321 $ 2,792,024
Interest expense....................................................................................................
.
3,673,482 4,601,269 1,785,044
Net interest income ..............................................................................................
.
2,422,811 2,336,052 1,006,980
Non-interest income.............................................................................................
.
813,742 939,638 595,096
Total revenue .......................................................................................................
.
3,236,553 3,275,690 1,602,076
Provision for loan and lease losses ......................................................................
.
447,643 32,178 602
Non-interest expense............................................................................................
.
2,443,369 2,333,955 1,269,868
Income before taxes .............................................................................................
.
345,541 909,557 331,606
Income taxes ........................................................................................................
.
120,939 316,464 116,062
Net income...........................................................................................................
.
$ 224,602 $ 593,093 $ 215,544
Selected Metrics (Managed Basis)
Commercial lending
Commercial and multi-family real estate (4) ................................................
.
13,382,909 12,414,263 891,140
Middle market (5) .........................................................................................
.
10,081,823 8,288,476 3,524,564
Small ticket commercial real estate (6).........................................................
.
2,609,123 2,948,402
Specialty lending (7).....................................................................................
.
3,547,287 3,396,100
Total commercial lending...........................................................................
.
29,621,142 27,047,241 4,415,704
Small business lending (8) ............................................................................
.
4,747,783 4,612,500 3,640,787
Consumer lending
Mortgages (9) ...............................................................................................
.
7,187,805 8,513,216 444,108
Branch based home equity & other consumer (10)........................................
.
3,773,397 4,095,228 3,816,185
Total consumer lending..............................................................................
.
10,961,202 12,608,444 4,260,293
Other (11) ......................................................................................................
.
(247,146 ) (295,390) (171,251)
Period end loans held for investment...................................................................
.
$ 45,082,981 $ 43,972,795 $ 12,145,533
Average loans held for investment.......................................................................
.
$ 44,318,212 $ 42,272,403 $ 13,225,559
Core deposits (1).....................................................................................................
.
$ 67,546,102 $ 62,977,637 $ 27,071,324
Total deposits.......................................................................................................
.
$ 78,938,391 $ 73,089,284 $ 35,187,965
Loans held for investment yield...........................................................................
.
6.42 % 7.04 % 7.75 %
Net interest marginloans (2) ...............................................................................
.
2.00 % 1.86 % 3.24 %
Net interest margindeposits (3) ...........................................................................
.
2.07 % 2.03 % 1.56 %
Efficiency ratio ....................................................................................................
.
75.49 % 71.25 % 79.26 %
Charge-off rates
Commercial lending ...................................................................................
.
Commercial and multi-family real estate..........................................
.
0.36 % 0.02 % 0.00 %
Middle market...................................................................................
.
0.21 % 0.04 % 0.14 %
Small ticket commercial real estate ..................................................
.
0.31 % 0.18 % 0.00 %
Specialty lending...............................................................................
.
0.24 % 0.11 % 0.00 %
Total commercial lending........................................................
.
0.29 % 0.05 % 0.11 %
Small business lending......................................................................
.
1.04 % 0.47 % 0.44 %
Consumer lending ......................................................................................
.
Mortgages .........................................................................................
.
0.35 % 0.11 % 0.07 %
Branch based home equity & other consumer ..................................
.
1.14 % 0.75 % 0.53 %
Total consumer lending...........................................................
.
0.62 % 0.31 % 0.37 %
Net charge-off rate ...............................................................................................
.
0.50 % 0.21 % 0.43 %
Non performing loans ..........................................................................................
.
$ 565,791 $ 178,385 $ 57,824
Foreclosed assets..................................................................................................
.
63,970 14,058 11,838
Non performing assets .........................................................................................
.
$ 629,761 $ 192,443 $ 69,662