Capital One 2008 Annual Report Download - page 116
Download and view the complete annual report
Please find page 116 of the 2008 Capital One annual report below. You can navigate through the pages in the report by either clicking on the pages listed below, or by using the keyword search tool below to find specific information within the annual report.-
 1
1 -
2
-
3
-
4
-
5
-
6
-
7
-
8
-
9
-
10
-
11
-
12
-
13
-
14
-
15
-
16
-
17
-
18
-
19
-
20
-
21
-
22
-
23
-
24
-
25
-
26
-
27
-
28
-
29
-
30
-
31
-
32
-
33
-
34
-
35
-
36
-
37
-
38
-
39
-
40
-
41
-
42
-
43
-
44
-
45
-
46
-
47
-
48
-
49
-
50
-
51
-
52
-
53
-
54
-
55
-
56
-
57
-
58
-
59
-
60
-
61
-
62
-
63
-
64
-
65
-
66
-
67
-
68
-
69
-
70
-
71
-
72
-
73
-
74
-
75
-
76
-
77
-
78
-
79
-
80
-
81
-
82
-
83
-
84
-
85
-
86
-
87
-
88
-
89
-
90
-
91
-
92
-
93
-
94
-
95
-
96
-
97
-
98
-
99
-
100
-
101
-
102
-
103
-
104
-
105
-
 106
106 -
 107
107 -
 108
108 -
 109
109 -
 110
110 -
 111
111 -
 112
112 -
 113
113 -
 114
114 -
 115
115 -
 116
116 -
 117
117 -
 118
118 -
 119
119 -
 120
120 -
 121
121 -
 122
122 -
 123
123 -
 124
124 -
 125
125 -
 126
126 -
127
-
128
-
129
-
130
-
131
-
132
-
133
-
134
-
135
-
136
-
137
-
138
-
139
-
140
-
141
-
142
-
143
-
144
-
145
-
146
-
147
-
148
-
149
-
150
-
151
-
152
-
153
-
154
-
155
-
156
-
157
-
158
-
159
-
160
-
161
-
162
-
163
-
164
-
165
-
166
-
167
-
168
-
169
-
170
-
171
-
172
-
173
-
174
-
175
-
176
-
177
-
178
-
179
-
180
-
181
-
182
-
183
-
184
-
185
-
186
 |
 |

98
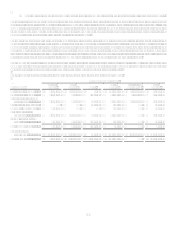
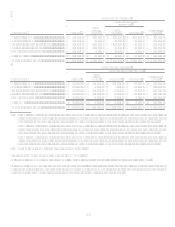
Year Ended December 31, 2007
Total Company
National
Lending
Local
Banking
Other
Total
Managed
Securitization
Adjustments(1)
Total
Reported
Net interest income ......... $ 8,841,236 $ 2,336,052 $ (157,538 ) $ 11,019,750 $ (4,489,905) $ 6,529,845
Non-interest income........ 4,870,727 939,638 (44,597 ) 5,765,768 2,288,455 8,054,223
Provision for loan and
lease losses ................. 4,691,687 32,178 114,087 4,837,952 (2,201,450) 2,636,502
Restructuring expenses ... 138,237 138,237 138,237
Other non-interest
expenses ..................... 5,420,204 2,333,955 185,614 7,939,773 7,939,773
Income tax provision
(benefit)...................... 1,237,163 316,464 (275,790 ) 1,277,837 1,277,837
Net income (loss)............ 2,362,909 593,093 (364,283 ) 2,591,719 2,591,719
Loans held for
investment .................. $ 106,508,443 $ 43,972,795 $ 881,179 $ 151,362,417 $ (49,557,390) $ 101,805,027
Total deposits.................. $ 2,050,861 $ 73,089,284 $ 7,621,031 $ 82,761,176 $ 82,761,176
Year Ended December 31, 2006
Total Company
National
Lending
Local
Banking
Other(2)
Total
Managed
Securitization
Adjustments(1)
Total
Reported
Net interest income ......... $ 7,896,134 $ 1,006,980 $ 29,578 $ 8,932,692 $ (3,841,246) $ 5,091,446
Non-interest income........ 4,375,126 595,096 (62,942 ) 4,907,280 2,093,744 7,001,024
Provision for loan and
lease losses ................. 3,207,646 602 15,692 3,223,940 (1,747,502) 1,476,438
Other non-interest
expenses ..................... 5,529,104 1,269,868 144,719 6,943,691 6,943,691
Income tax provision
(benefit)...................... 1,240,608 116,062 (110,706 ) 1,245,964 1,245,964
Net income (loss)............ $ 2,293,902 $ 215,544 $ (83,069 ) $ 2,426,376 $ 2,426,377
Loans held for
investment .................. $ 102,359,180 $ 12,145,533 $ 31,646,555 $ 146,151,268 $ (49,639,129) $ 96,512,139
Total deposits.................. $ 2,383,902 $ 35,187,965 $ 48,052,380 $ 85,624,247 $ $ 85,624,247
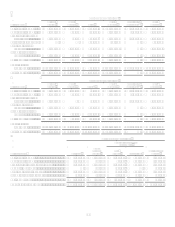
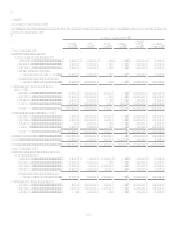
Year Ended December 31, 2008
Other National Lending
sub-segments
National Lending
U.S. Card
Other
National
Lending
Auto
Finance
International
Total National
Lending
Net interest income ............................................ $ 6,492,086 $ 2,498,788 $ 1,527,394 $ 971,394 $ 8,990,874
Non-interest income........................................... 4,127,615 609,997 59,235
550,762 4,737,612
Provision for loan and lease losses .................... 5,460,986 1,967,490 1,320,515
646,975 7,428,476
Goodwill impairment......................................... 810,876 810,876
810.876
Other non-interest expenses............................... 3,618,639 1,275,259 503,942
771,317 4,893,898
Income tax provision (benefit)........................... 539,026 (53,761) (89,759) 35,998 485,265
Net income (loss)............................................... $ 1,001,050 $ (891,079) $ (958,945) $ 67,866 $ 109,971
Loans held for investment.................................. $ 70,944,581 $ 30,202,553 $ 21,481,911 $ 8,720,642 101,147,134