Capital One 2008 Annual Report Download - page 139
Download and view the complete annual report
Please find page 139 of the 2008 Capital One annual report below. You can navigate through the pages in the report by either clicking on the pages listed below, or by using the keyword search tool below to find specific information within the annual report.-
 1
1 -
2
-
3
-
4
-
5
-
6
-
7
-
8
-
9
-
10
-
11
-
12
-
13
-
14
-
15
-
16
-
17
-
18
-
19
-
20
-
21
-
22
-
23
-
24
-
25
-
26
-
27
-
28
-
29
-
30
-
31
-
32
-
33
-
34
-
35
-
36
-
37
-
38
-
39
-
40
-
41
-
42
-
43
-
44
-
45
-
46
-
47
-
48
-
49
-
50
-
51
-
52
-
53
-
54
-
55
-
56
-
57
-
58
-
59
-
60
-
61
-
62
-
63
-
64
-
65
-
66
-
67
-
68
-
69
-
70
-
71
-
72
-
73
-
74
-
75
-
76
-
77
-
78
-
79
-
80
-
81
-
82
-
83
-
84
-
85
-
86
-
87
-
88
-
89
-
90
-
91
-
92
-
93
-
94
-
95
-
96
-
97
-
98
-
99
-
100
-
101
-
102
-
103
-
104
-
105
-
106
-
107
-
108
-
109
-
110
-
111
-
112
-
113
-
114
-
115
-
116
-
117
-
118
-
119
-
120
-
121
-
122
-
123
-
124
-
125
-
126
-
127
-
128
-
 129
129 -
 130
130 -
 131
131 -
 132
132 -
 133
133 -
 134
134 -
 135
135 -
 136
136 -
 137
137 -
 138
138 -
 139
139 -
 140
140 -
 141
141 -
 142
142 -
 143
143 -
 144
144 -
 145
145 -
 146
146 -
 147
147 -
 148
148 -
 149
149 -
150
-
151
-
152
-
153
-
154
-
155
-
156
-
157
-
158
-
159
-
160
-
161
-
162
-
163
-
164
-
165
-
166
-
167
-
168
-
169
-
170
-
171
-
172
-
173
-
174
-
175
-
176
-
177
-
178
-
179
-
180
-
181
-
182
-
183
-
184
-
185
-
186
 |
 |

121
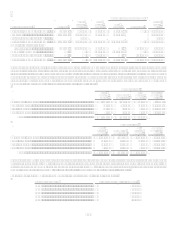
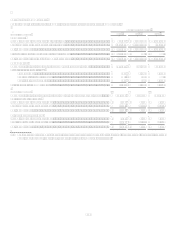
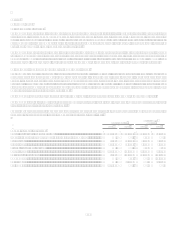
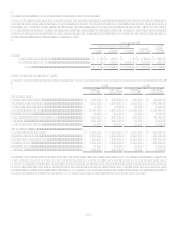
Earnings Per Common Share
The following table sets forth the computation of basic and diluted earnings per common share:
Year Ended December 31
(Shares in Thousands) 2008
2007
2006
Numerator:
Income from continuing operations, net of tax ...............................................................
.
$ 84,517 $ 2,591,719 $ 2,426,377
Loss from discontinued operations, net of tax ................................................................
.
(130,515) (1,021,387) (11,884)
Net income (loss)............................................................................................................
.
$ (45,998) $ 1,570,332 $ 2,414,493
Preferred stock dividends and accretion of discount.......................................................
.
$ (32,723) $ $
Net income (loss) available to common shareholders.....................................................
.
$ (78,721) $ 1,570,332 $ 2,414,493
Denominator:
Denominator for basic earnings per share-Weighted-average shares .............................
.
376,282 390,287 309,584
Effect of dilutive securities (1):
Stock options .........................................................................................................
.
394 4,327 6,171
Contingently issuable shares .................................................................................
.
192
Restricted stock and units......................................................................................
.
991 739 1,268
Dilutive potential common shares...................................................................................
.
1,385 5,258 7,439
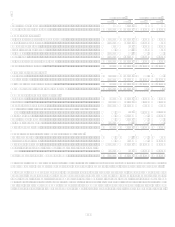
(Shares in Thousands)
Denominator for diluted earnings per share-Adjusted weighted-average shares...........
.
377,667 395,545 317,023
Basic earnings per share
Income from continuing operations ...............................................................................
.
$ 0.14 $ 6.64 $ 7.84
Loss from discontinued operations ................................................................................
.
(0.35 ) (2.62 ) (0.04 )
Net income (loss)...........................................................................................................
.
$ (0.21 ) $ 4.02 $ 7.80
Diluted earnings per share
Income from continuing operations ...............................................................................
.
$ 0.14 $ 6.55 $ 7.65
Loss from discontinued operations ................................................................................
.
(0.35) (2.58 ) (0.03)
Net income (loss)...........................................................................................................
.
$ (0.21) $ 3.97 $ 7.62
(1) Excluded from the computation of diluted earnings per share was 27.7 million, 7.4 million and 4.5 million securities during
2008, 2007 and 2006, respectively, because their inclusion would be antidilutive.