Capital One 2008 Annual Report Download - page 72
Download and view the complete annual report
Please find page 72 of the 2008 Capital One annual report below. You can navigate through the pages in the report by either clicking on the pages listed below, or by using the keyword search tool below to find specific information within the annual report. 54
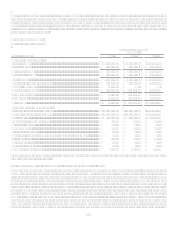
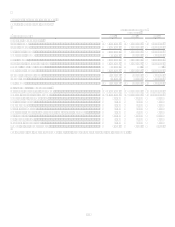
Year Ended December 31, 2008 Compared to Year Ended December 31, 2007
The Local Banking segment contributed $224.6 million of net income during 2008, compared to $593.1 million during 2007. At
December 31, 2008, loans outstanding in the Local Banking segment totaled $45.1 billion while deposit balances totaled $78.9 billion
compared to loans outstanding of $44.0 billion and deposits of $73.1 billion at December 31, 2007. The increase in loans can be
attributed to 9.5% growth in commercial loans, primarily in our middle market portfolio as the Gulf South region, with a concentration
in the energy sector, weathered the economic downturn better than other markets, partially offset by runoff in our residential mortgage
portfolio. Deposits grew 8%, primarily driven by increases in our national direct and our consumer branch deposits.
Local Banking segment profits are primarily generated from net interest income, which represents the yield earned on the loans less
the internal transfer price charged to the business for those loans, plus the spread between deposit interest costs and the funds transfer
price credited to the business for those deposits. During 2008, the Local Banking segment generated net interest income of $2.4 billion
compared to $2.3 billion during 2007. The increase in net interest income can be attributed to higher net interest margin on both loans
and deposits.
Non-interest income declined from $939.9 million in 2007 to $813.7 million in 2008. Compared to 2007, mortgage originations
decreased significantly due to the continued industry-wide challenges in the mortgage market. Lower gain on sale revenue and an
increase in representation and warranty reserves resulted in a year over year decline of $102.7 million in non-interest income. In
addition, revenue in the mortgage servicing business declined $19.0 million in 2008 from 2007 as the principal balance of loans
serviced continued to decline year over year.
Provision for loan and lease losses was $447.6 million in 2008 compared to $32.2 million in 2007, as charge-offs increased to $222.4
million and an increase to the allowance for loan and lease losses. The increase in provision expense was related to the deterioration in
the economy during 2008. Deteriorating economic conditions negatively impacted borrowers ability to repay and decreased collateral
values, resulting in an increase in criticized and non-performing loans and charge-offs during the year.
Non-interest expenses were $2.4 billion in 2008, compared to $2.3 billion in 2007. In addition to investments in branches and other
infrastructure projects, during 2008 the Local Banking segment continued to incur North Fork Bank integration costs such as brand
conversion and deposit system integration. In 2008, the Company opened 21 new banking locations across Louisiana, New Jersey,
New York, Texas and Virginia while closing 24 branches. The costs of operating these branches, including lease costs, depreciation
and personnel, is included in non-interest expense.
Year Ended December 31, 2007 Compared to Year Ended December 31, 2006
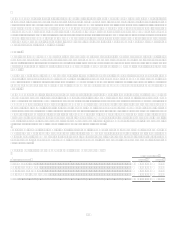
The Local Banking segment contributed $574.2 million of net income during 2007, compared to $178.6 million during 2006. At
December 31, 2007, loans outstanding in the Local Banking segment totaled $44.0 billion while deposits outstanding totaled $73.3
billion. The increases in loans and deposits outstanding are due primarily to the addition of the loan and deposit portfolios of North
Fork Bank, along with modest growth in loans and deposits during 2007. As of December 31, 2006, North Fork loan and deposit
balances of $30.1 billion and $37.8 billion, respectively, were included in the Other segment.
Local Banking segment profits are primarily generated from net interest income, which represents the spread between loan yields and
the internal cost of funds charged to the business for those loans, plus the spread between deposit interest costs and the funds transfer
price credited to the business for those deposits. During 2007, the Local Banking segment generated net interest income of $2.3 billion
compared to $996.9 million during 2006. The increase is due to the increase in loan and deposit outstandings mentioned above. The
net interest margin on loans was lower in 2007 than 2006 because of the addition of the North Fork loan portfolio, which contained a
higher percentage of lower yielding loans than the Hibernia portfolio. Net interest margins on deposits are higher in 2007 than in 2006
because of the addition of the lower cost North Fork deposit portfolio to the existing Hibernia and Capital One deposits.
The provision for loan losses increased to $32.1 million in 2007 from $0.4 million in 2006. The increase is primarily the result of the
addition of the North Fork loan portfolios in 2007, offset by a $91.4 million reduction in the allowance for loan losses to conform the
allowance for loan and lease losses methodology of the Local Banking segment to the Companys established methodology. In
addition, during 2006, $25.7 million of allowance for loan losses previously established to cover expected losses in the portion of the
loan portfolio impacted by Hurricanes Katrina and Rita was no longer needed and these amounts reduced the overall provision
expense in 2006.


