Capital One 2008 Annual Report Download - page 169
Download and view the complete annual report
Please find page 169 of the 2008 Capital One annual report below. You can navigate through the pages in the report by either clicking on the pages listed below, or by using the keyword search tool below to find specific information within the annual report.-
 1
1 -
2
-
3
-
4
-
5
-
6
-
7
-
8
-
9
-
10
-
11
-
12
-
13
-
14
-
15
-
16
-
17
-
18
-
19
-
20
-
21
-
22
-
23
-
24
-
25
-
26
-
27
-
28
-
29
-
30
-
31
-
32
-
33
-
34
-
35
-
36
-
37
-
38
-
39
-
40
-
41
-
42
-
43
-
44
-
45
-
46
-
47
-
48
-
49
-
50
-
51
-
52
-
53
-
54
-
55
-
56
-
57
-
58
-
59
-
60
-
61
-
62
-
63
-
64
-
65
-
66
-
67
-
68
-
69
-
70
-
71
-
72
-
73
-
74
-
75
-
76
-
77
-
78
-
79
-
80
-
81
-
82
-
83
-
84
-
85
-
86
-
87
-
88
-
89
-
90
-
91
-
92
-
93
-
94
-
95
-
96
-
97
-
98
-
99
-
100
-
101
-
102
-
103
-
104
-
105
-
106
-
107
-
108
-
109
-
110
-
111
-
112
-
113
-
114
-
115
-
116
-
117
-
118
-
119
-
120
-
121
-
122
-
123
-
124
-
125
-
126
-
127
-
128
-
129
-
130
-
131
-
132
-
133
-
134
-
135
-
136
-
137
-
138
-
139
-
140
-
141
-
142
-
143
-
144
-
145
-
146
-
147
-
148
-
149
-
150
-
151
-
152
-
153
-
154
-
155
-
156
-
157
-
158
-
 159
159 -
 160
160 -
 161
161 -
 162
162 -
 163
163 -
 164
164 -
 165
165 -
 166
166 -
 167
167 -
 168
168 -
 169
169 -
 170
170 -
 171
171 -
 172
172 -
 173
173 -
 174
174 -
 175
175 -
 176
176 -
 177
177 -
 178
178 -
 179
179 -
180
-
181
-
182
-
183
-
184
-
185
-
186
 |
 |

151
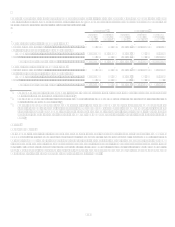
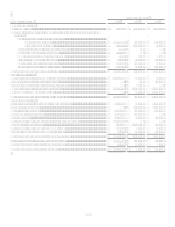
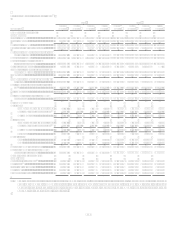
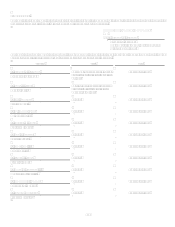
Note 25
Capital One Financial Corporation (Parent Company Only)
Condensed Financial Information
The following Parent Company Only financial statements are provided in accordance with Regulation S-X of the Securities and
Exchange Commission which requires all issuers or guarantors of registered securities to include separate annual financial statements.
December 31
Balance Sheets
2008
2007
Assets: .................................................................................................................................................
.
Cash and cash equivalents ...................................................................................................................
.
$ 8,546,995
$ 24,702
Investment in subsidiaries....................................................................................................................
.
25,323,057
26,916,546
Loans to subsidiaries............................................................................................................................
.
1,189,173
6,604,075
Securities available for sale .................................................................................................................
.
6,840
16,420
Other ....................................................................................................................................................
.
983,920
566,297
Total assets .................................................................................................................................
.
$ 36,049,985 $ 34,128,040
Liabilities:
Senior and subordinated notes .............................................................................................................
.
$ 6,385,417
$ 7,187,007
Other borrowings .................................................................................................................................
.
1,652,948
1,921,295
Other ....................................................................................................................................................
.
1,399,187
725,626
Total liabilities............................................................................................................................
.
9,437,552
9,833,928
Stockholders Equity:
Preferred stock .....................................................................................................................................
.
3,096,466
Common stock .....................................................................................................................................
.
4,384
4,192
Paid-in-capital, net...............................................................................................................................
.
17,278,092
15,860,490
Retained earnings.................................................................................................................................
.
9,399,378
11,582,816
Less: Treasury stock, at cost.......................................................................................................
.
(3,165,887) (3,153,386)
Stockholders equity...................................................................................................................
.
26,612,433
24,294,112
Total liabilities and stockholders equity....................................................................................
.
$ 36,049,985 $ 34,128,040
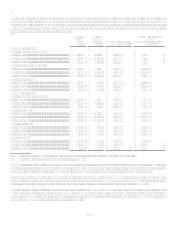
Year Ended December 31
Statements of Income
2008
2007
2006
Interest from temporary investments ........................................................................... $ 184,234 $ 300,394 $ 323,870
Interest expense............................................................................................................ 424,541
504,708 265,585
Dividends, principally from bank subsidiaries............................................................. 1,546,810
2,056,639 1,950,000
Non-interest income..................................................................................................... 110,911
12,982 4,807
Non-interest expense.................................................................................................... 137,265
241,660 129,491
Income before income taxes and equity in undistributed earnings of subsidiaries ...... 1,280,149 1,623,647 1,883,601
Income tax (benefit) expense ....................................................................................... (93,552) (245,052) (67,653)
Equity in undistributed earnings (loss) of subsidiaries ................................................ (1,289,184) 723,020 475,123
Income from continuing operations, net of tax ............................................................ 84,517 2,591,719 2,426,377
Loss from discontinued operations, net of tax ............................................................. (130,515) (1,021,387) (11,884)
Net income (loss)......................................................................................................... $ (45,998) $ 1,570,332 $ 2,414,493