Capital One 2008 Annual Report Download - page 121
Download and view the complete annual report
Please find page 121 of the 2008 Capital One annual report below. You can navigate through the pages in the report by either clicking on the pages listed below, or by using the keyword search tool below to find specific information within the annual report.-
 1
1 -
2
-
3
-
4
-
5
-
6
-
7
-
8
-
9
-
10
-
11
-
12
-
13
-
14
-
15
-
16
-
17
-
18
-
19
-
20
-
21
-
22
-
23
-
24
-
25
-
26
-
27
-
28
-
29
-
30
-
31
-
32
-
33
-
34
-
35
-
36
-
37
-
38
-
39
-
40
-
41
-
42
-
43
-
44
-
45
-
46
-
47
-
48
-
49
-
50
-
51
-
52
-
53
-
54
-
55
-
56
-
57
-
58
-
59
-
60
-
61
-
62
-
63
-
64
-
65
-
66
-
67
-
68
-
69
-
70
-
71
-
72
-
73
-
74
-
75
-
76
-
77
-
78
-
79
-
80
-
81
-
82
-
83
-
84
-
85
-
86
-
87
-
88
-
89
-
90
-
91
-
92
-
93
-
94
-
95
-
96
-
97
-
98
-
99
-
100
-
101
-
102
-
103
-
104
-
105
-
106
-
107
-
108
-
109
-
110
-
 111
111 -
 112
112 -
 113
113 -
 114
114 -
 115
115 -
 116
116 -
 117
117 -
 118
118 -
 119
119 -
 120
120 -
 121
121 -
 122
122 -
 123
123 -
 124
124 -
 125
125 -
 126
126 -
 127
127 -
 128
128 -
 129
129 -
 130
130 -
 131
131 -
132
-
133
-
134
-
135
-
136
-
137
-
138
-
139
-
140
-
141
-
142
-
143
-
144
-
145
-
146
-
147
-
148
-
149
-
150
-
151
-
152
-
153
-
154
-
155
-
156
-
157
-
158
-
159
-
160
-
161
-
162
-
163
-
164
-
165
-
166
-
167
-
168
-
169
-
170
-
171
-
172
-
173
-
174
-
175
-
176
-
177
-
178
-
179
-
180
-
181
-
182
-
183
-
184
-
185
-
186
 |
 |

103
The increase in the securities available for sale portfolio was due to the Companys decision to increase its available liquidity in
response to the dislocation in the capital markets. The composition of the available-for-sale investment portfolio are held in the
investment portfolio and continue to be heavily concentrated in high credit quality assets like government sponsored enterprise
(GSE) mortgage-backed securities and AAA rated asset-backed securities. In addition to securities held in the investment portfolio,
the Company reports certain equity investments related to Community Reinvestment Act (CRA) investments in the available for
sale investment portfolio.
At December 31, 2008 the portfolio was 95% rated AAA and had virtually no sub-prime or alt-A exposure. The investment portfolio
experienced a substantial increase in the unrealized loss position over the year ended December 31, 2008, which was driven primarily
by our prime non-agency mortgage-backed securities holdings.
The Company monitors securities in its available for sale investment portfolio for other-than-temporary impairment based on a
number of criteria, including the size of the unrealized loss position, the duration for which that security has been in a loss position,
credit rating, the nature of the investments, current market conditions, and the Companys intent and ability to hold the securities until
anticipated recovery, which may be maturity. The Company continually monitors the ratings of our security holdings and conducts
regular reviews of the Companys credit sensitive assets to monitor collateral performance by tracking collateral trends and looking
for any potential collateral degradation.
Based on the evaluation, the Company recognized other-than-temporary impairment charges of $10.9 million for the year ended
December 31, 2008. No other-than-temporary impairment was recognized for the years ended December 31, 2007 and 2006.
Unrealized gains and losses on securities included gross unrealized gains of $373.3 million, $118.8 million and $62.2 million, and
gross unrealized losses of $1.5 billion, $96.5 million, and $158.8 million, as of December 31, 2008, 2007, and 2006, respectively.
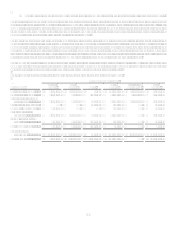
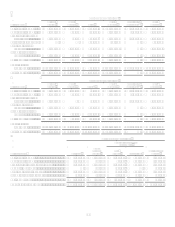
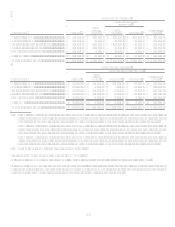
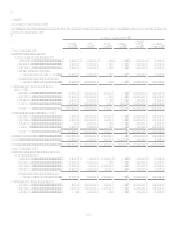
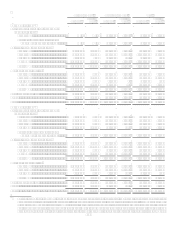
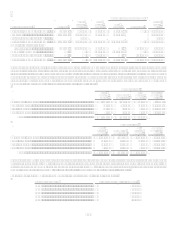
The following table shows the Companys investments gross unrealized losses and fair value of the investments in an unrealized loss
position, aggregated by investment category, at December 31, 2008, 2007, and 2006, respectively.
Less than 12 Months
Greater than 12 Months
Total
Fair Value
Unrealized
Losses
Fair Value
Unrealized
Losses
Fair Value
Unrealized
Losses
December 31, 2008
U.S. Treasury and other U.S. government
agency obligations
Freddie Mac.........................................
.
$ $ $ 30,097 $ 821 $ 30,097 $ 821
Other GSE and DGP............................
.
179,728 272 179,728 272
Total U.S. Treasury and other U.S.
government agency obligations ......
.
179,728 272 30,097 821 209,825 1,093
Collateralized mortgage obligations
Fannie Mae..........................................
.
266,344 8,125 367,472 13,574 633,816 21,699
Freddie Mac.........................................
.
307,667 2,445 729,283 25,406 1,036,950 27,851
Other GSE ...........................................
.
11,159 224 11,159 224
Non GSE .............................................
.
1,652,139 523,953 265,608 80,354 1,917,747 604,307
Total CMO ..........................................
.
2,226,150 534,523 1,373,522 119,558 3,599,672 654,081
Mortgage backed securities
Fannie Mae..........................................
.
982,232 10,782 160,456 818 1,142,688 11,600
Freddie Mac.........................................
.
721,443 20,671 155,234 3,385 876,677 24,056
Other GSE ...........................................
.
26,265 971 7,108 163 33,373 1,134
Non GSE .............................................
.
668,837 349,753 158,870 81,183 827,707 430,936
Total MBS...........................................
.
2,398,777 382,177 481,668 85,549 2,880,445 467,726
Asset backed securities .................................
.
2,660,798 194,024 692,928 145,470 3,353,726 339,494
Other .............................................................
.
107,126 2,704 120,183 16,530 227,309 19,234
Total..............................................................
.
$ 7,572,579 $ 1,113,700 $ 2,698,398 $ 367,928 $ 10,270,977 $ 1,481,628