Capital One 2008 Annual Report Download - page 146
Download and view the complete annual report
Please find page 146 of the 2008 Capital One annual report below. You can navigate through the pages in the report by either clicking on the pages listed below, or by using the keyword search tool below to find specific information within the annual report.-
 1
1 -
2
-
3
-
4
-
5
-
6
-
7
-
8
-
9
-
10
-
11
-
12
-
13
-
14
-
15
-
16
-
17
-
18
-
19
-
20
-
21
-
22
-
23
-
24
-
25
-
26
-
27
-
28
-
29
-
30
-
31
-
32
-
33
-
34
-
35
-
36
-
37
-
38
-
39
-
40
-
41
-
42
-
43
-
44
-
45
-
46
-
47
-
48
-
49
-
50
-
51
-
52
-
53
-
54
-
55
-
56
-
57
-
58
-
59
-
60
-
61
-
62
-
63
-
64
-
65
-
66
-
67
-
68
-
69
-
70
-
71
-
72
-
73
-
74
-
75
-
76
-
77
-
78
-
79
-
80
-
81
-
82
-
83
-
84
-
85
-
86
-
87
-
88
-
89
-
90
-
91
-
92
-
93
-
94
-
95
-
96
-
97
-
98
-
99
-
100
-
101
-
102
-
103
-
104
-
105
-
106
-
107
-
108
-
109
-
110
-
111
-
112
-
113
-
114
-
115
-
116
-
117
-
118
-
119
-
120
-
121
-
122
-
123
-
124
-
125
-
126
-
127
-
128
-
129
-
130
-
131
-
132
-
133
-
134
-
135
-
 136
136 -
 137
137 -
 138
138 -
 139
139 -
 140
140 -
 141
141 -
 142
142 -
 143
143 -
 144
144 -
 145
145 -
 146
146 -
 147
147 -
 148
148 -
 149
149 -
 150
150 -
 151
151 -
 152
152 -
 153
153 -
 154
154 -
 155
155 -
 156
156 -
157
-
158
-
159
-
160
-
161
-
162
-
163
-
164
-
165
-
166
-
167
-
168
-
169
-
170
-
171
-
172
-
173
-
174
-
175
-
176
-
177
-
178
-
179
-
180
-
181
-
182
-
183
-
184
-
185
-
186
 |
 |

128
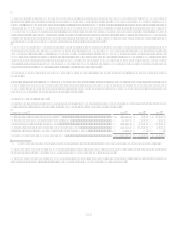
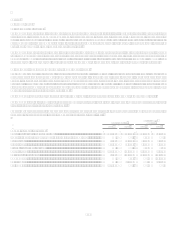
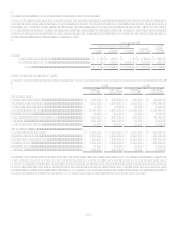
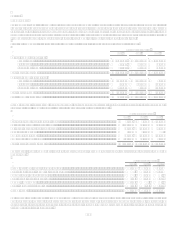
Assets and Liabilities Measured at Fair Value on a Nonrecurring Basis
The Company is also required to measure and recognize certain other financial assets at fair value on a nonrecurring basis in the
consolidated balance sheet. For assets measured at fair value on a nonrecurring basis in 2008 and still held on the consolidated balance
sheet at December 31, 2008, the following table provides the fair value measures by level of valuation assumptions used and the
amount of fair value adjustments recorded in earnings for those assets in 2008. Fair value adjustments for mortgage loans held for sale
are recorded in other non-interest expense and fair value adjustments for loans held for investment are recorded in provision for loan
and lease losses in the consolidated statement of income.
December 31, 2008
Fair Value Measurements Using
Level 1
Level 2
Level 3
Assets at
Fair Value
Total
Losses in
2008
Assets
Mortgage loans held for sale ...................................................... $ $ 68,462 $ $ 68, 462 $ 14,386
Loans held for investment .......................................................... 64,737 142,768 207,505 62,747
Total ................................................................................. $ $ 133,199 $ 142,768 $ 275,967 $ 77,133
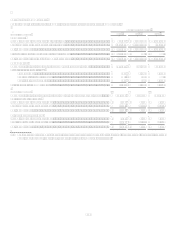
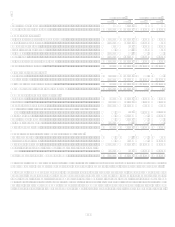
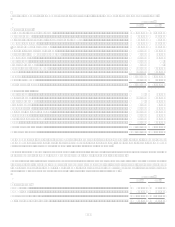
Fair Value of Financial Instruments
The following reflects the fair value of financial instruments whether or not recognized on the consolidated balance sheet at fair value.
2008
2007
Carrying
Amount
Estimated
Fair Value
Carrying
Amount
Estimated
Fair Value
Financial Assets
Cash and cash equivalents ........................................................ $ 7,491,343 $ 7,491,343
$ 4,821,409 $ 4,821,409
Securities available for sale ...................................................... 31,003,271 31,003,271
19,781,587 19,781,587
Mortgage loans held for sale..................................................... 68,462 68,462
315,863 315,863
Loans held for investment......................................................... 101,017,771 86,370,194
101,805,027 104,822,251
Interest receivable ..................................................................... 827,909 827,909
839,317 839,317
Accounts receivable from securitization................................... 6,342,754 6,342,754
4,717,879 4,717,879
Derivatives................................................................................ 1,836,817 1,836,817
563,272 563,272
Mortgage servicing rights ......................................................... 150,544 150,544
247,589 247,589
Financial Liabilities ................................................................
Non-interest bearing deposits $ 11,293,852 $ 11,293,852
$ 11,046,549 $ 11,046,549
Interest-bearing deposits ........................................................... 97,326,937 98,031,913
71,714,627 70,528,579
Senior and subordinated notes .................................................. 8,308,843 6,922,300
10,712,706 10,141,310
Other borrowings ...................................................................... 14,869,648 12,948,145
26,812,969 26,290,579
Interest payable......................................................................... 676,398 676,398
631,609 631,609
Derivatives................................................................................ 1,321,671 1,321,671
529,390 529,390
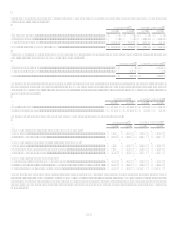
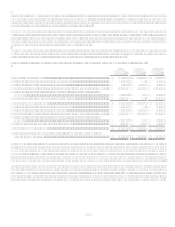
The following describes the valuation techniques used in estimating the fair value of the Companys financial instruments as of
December 31, 2008 and 2007. At December 31, 2008, the Company applied the provisions of SFAS 157 to the fair value
measurements of financial instruments not recognized on the consolidated balance sheet at fair value, which include loans held for
investment, interest receivable, non-interest bearing and interest bearing deposits, other borrowings, senior and subordinated notes,
and interest payable. The provisions requiring the Company to maximize the use of observable inputs and to measure fair value using
a notion of exit price were factored into the Companys selection of inputs into its established valuation techniques.