Capital One 2008 Annual Report Download - page 126
Download and view the complete annual report
Please find page 126 of the 2008 Capital One annual report below. You can navigate through the pages in the report by either clicking on the pages listed below, or by using the keyword search tool below to find specific information within the annual report.-
 1
1 -
2
-
3
-
4
-
5
-
6
-
7
-
8
-
9
-
10
-
11
-
12
-
13
-
14
-
15
-
16
-
17
-
18
-
19
-
20
-
21
-
22
-
23
-
24
-
25
-
26
-
27
-
28
-
29
-
30
-
31
-
32
-
33
-
34
-
35
-
36
-
37
-
38
-
39
-
40
-
41
-
42
-
43
-
44
-
45
-
46
-
47
-
48
-
49
-
50
-
51
-
52
-
53
-
54
-
55
-
56
-
57
-
58
-
59
-
60
-
61
-
62
-
63
-
64
-
65
-
66
-
67
-
68
-
69
-
70
-
71
-
72
-
73
-
74
-
75
-
76
-
77
-
78
-
79
-
80
-
81
-
82
-
83
-
84
-
85
-
86
-
87
-
88
-
89
-
90
-
91
-
92
-
93
-
94
-
95
-
96
-
97
-
98
-
99
-
100
-
101
-
102
-
103
-
104
-
105
-
106
-
107
-
108
-
109
-
110
-
111
-
112
-
113
-
114
-
115
-
 116
116 -
 117
117 -
 118
118 -
 119
119 -
 120
120 -
 121
121 -
 122
122 -
 123
123 -
 124
124 -
 125
125 -
 126
126 -
 127
127 -
 128
128 -
 129
129 -
 130
130 -
 131
131 -
 132
132 -
 133
133 -
 134
134 -
 135
135 -
 136
136 -
137
-
138
-
139
-
140
-
141
-
142
-
143
-
144
-
145
-
146
-
147
-
148
-
149
-
150
-
151
-
152
-
153
-
154
-
155
-
156
-
157
-
158
-
159
-
160
-
161
-
162
-
163
-
164
-
165
-
166
-
167
-
168
-
169
-
170
-
171
-
172
-
173
-
174
-
175
-
176
-
177
-
178
-
179
-
180
-
181
-
182
-
183
-
184
-
185
-
186
 |
 |

108
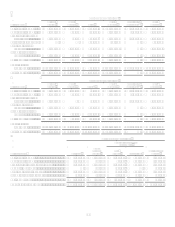
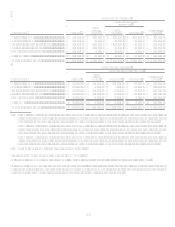
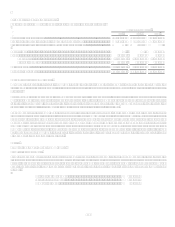
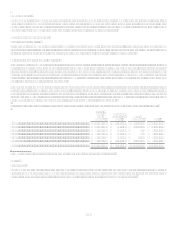
Weighted average yields were determined based on amortized cost and are distributed based on expected maturities. Actual maturities
could differ because issuers and/or the underlying borrowers may have the right to call or prepay obligations.
Gross realized gains on sales and calls of securities were $14.6 million, $71.2 million, and $36.8 million for the years ended
December 31, 2008, 2007, and 2006, respectively. Gross realized losses on sales and calls of securities were $0.9 million, $1.2
million, and $66.0 million for the years ended December 31, 2008, 2007, and 2006, respectively. Tax expenses (benefits) on net
realized gains (losses) were $5.0 million, $25.0 million, and $(10.6) million for the years ended December 31, 2008, 2007 and 2006.
Securities available for sale included pledged securities of $13.7 billion, $9.3 billion, and $9.5 billion at December 31, 2008, 2007,
and 2006, respectively.
Note 5
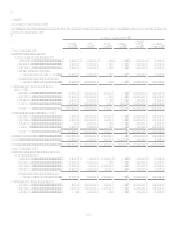
Loans Held for Investment, Allowance for Loan and Lease Losses and Unfunded Lending Commitments
Loans Held for Investment
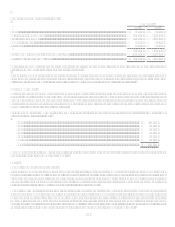
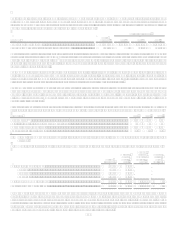
The composition of the loans held for investment portfolio was as follows:
December 31
2008
2007
Year-End Balances:
Reported loans:
Consumer loans:......................................................................................................................
.
Credit cards....................................................................................................................
.
Domestic ..............................................................................................................
.
$ 16,954,281 $ 13,130,866
International .........................................................................................................
.
2,873,764 3,661,661
Total credit cards ...........................................................................................................
.
19,828,045 16,792,527
Installment loans
Domestic ..............................................................................................................
.
10,130,678 9,966,818
International .........................................................................................................
.
119,320 354,556
Total installment loans...................................................................................................
.
10,249,998 10,321,374
Auto loans ...............................................................................................................................
.
21,491,285 25,038,294
Mortgage loans........................................................................................................................
.
10,663,598 12,296,575
Total consumer loans ........................................................................................................................
.
62,232,926 64,448,770
Commercial loans .............................................................................................................................
.
38,784,845 37,356,257
Total reported loans held for investment ..........................................................................................
.
$ 101,017,771 $ 101,805,027
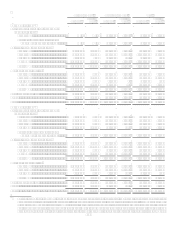
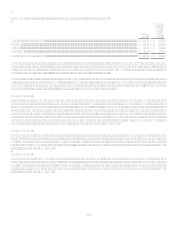
Loans totaling approximately $998.6 million and $799.9 million, representing amounts which were greater than 90 days past due,
were included in the Companys reported loan portfolio as of December 31, 2008 and 2007, respectively. These delinquencies include
nonaccrual consumer auto loans of $164.6 million in 2008 and $159.8 million in 2007.
Loans that were considered individually impaired in accordance with SFAS No. 114 at December 31, 2008 and 2007 were $461.2
million and $122.8 million, respectively. The Company had a corresponding specific allowance for loan and lease losses of $64.3
million and $8.4 million at December 31, 2008 and 2007, respectively, relating to impaired loans of $272.2 million and $48.8 million
at December 31, 2008 and 2007, respectively. The average balance of impaired loans was $271.9 million in 2008 and $74.8 million in
2007. Interest income recognized during 2008 and 2007 related to impaired loans was not material.