Capital One 2008 Annual Report Download - page 167
Download and view the complete annual report
Please find page 167 of the 2008 Capital One annual report below. You can navigate through the pages in the report by either clicking on the pages listed below, or by using the keyword search tool below to find specific information within the annual report.-
 1
1 -
2
-
3
-
4
-
5
-
6
-
7
-
8
-
9
-
10
-
11
-
12
-
13
-
14
-
15
-
16
-
17
-
18
-
19
-
20
-
21
-
22
-
23
-
24
-
25
-
26
-
27
-
28
-
29
-
30
-
31
-
32
-
33
-
34
-
35
-
36
-
37
-
38
-
39
-
40
-
41
-
42
-
43
-
44
-
45
-
46
-
47
-
48
-
49
-
50
-
51
-
52
-
53
-
54
-
55
-
56
-
57
-
58
-
59
-
60
-
61
-
62
-
63
-
64
-
65
-
66
-
67
-
68
-
69
-
70
-
71
-
72
-
73
-
74
-
75
-
76
-
77
-
78
-
79
-
80
-
81
-
82
-
83
-
84
-
85
-
86
-
87
-
88
-
89
-
90
-
91
-
92
-
93
-
94
-
95
-
96
-
97
-
98
-
99
-
100
-
101
-
102
-
103
-
104
-
105
-
106
-
107
-
108
-
109
-
110
-
111
-
112
-
113
-
114
-
115
-
116
-
117
-
118
-
119
-
120
-
121
-
122
-
123
-
124
-
125
-
126
-
127
-
128
-
129
-
130
-
131
-
132
-
133
-
134
-
135
-
136
-
137
-
138
-
139
-
140
-
141
-
142
-
143
-
144
-
145
-
146
-
147
-
148
-
149
-
150
-
151
-
152
-
153
-
154
-
155
-
156
-
 157
157 -
 158
158 -
 159
159 -
 160
160 -
 161
161 -
 162
162 -
 163
163 -
 164
164 -
 165
165 -
 166
166 -
 167
167 -
 168
168 -
 169
169 -
 170
170 -
 171
171 -
 172
172 -
 173
173 -
 174
174 -
 175
175 -
 176
176 -
 177
177 -
178
-
179
-
180
-
181
-
182
-
183
-
184
-
185
-
186
 |
 |

149
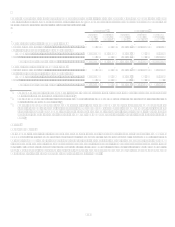
Note 22
Significant Concentration of Credit Risk
The Company is active in originating loans in the United States and internationally. International loans are originated primarily in
Canada and the United Kingdom. The Company reviews each potential customers credit application and evaluates the applicants
financial history and ability and willingness to repay. Loans are made on an unsecured and secured basis. Certain commercial, small
business, mortgage and automobile loans require collateral in various forms including cash deposits, automobiles and real estate, as
appropriate. The Company has higher concentrations of loans where the Local Banking segment operates, the South and Northeast
regions of the U.S. In particular, the Companys commercial portfolio is concentrated in the New York metropolitan area. The
regional economic conditions in the New York area affect the demand for the Companys commercial products and services as well as
the ability of our customers to repay their commercial loans and the value of the collateral securing these loans. The geographic
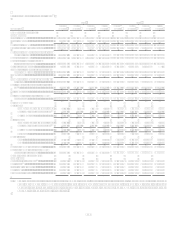
distribution of the Companys loans was as follows:
December 31
2008
2007
Loans
Percentage
of Total
Loans
Percentage
of Total
Geographic Region:
International
U.K............................................................................................. $ 5,527,552 3.76% $ 8,075,609 5.34 %
Canada........................................................................................ 3,193,405 2.18% 3,585,940 2.37 %
Total International ...................................................................... 8,720,957 5.94% 11,661,549 7.71 %
Domestic
South .......................................................................................... 53,572,603 36.46% 51,848,365 34.25 %
West............................................................................................ 23,662,216 16.10% 25,426,312 16.80 %
Midwest...................................................................................... 19,900,659 13.54% 20,691,790 13.67 %
Northeast .................................................................................... 41,080,320 27.96% 41,734,401 27.57 %
Total Domestic ........................................................................... 138,215,798 94.06% 139,700,868 92.29 %
146,936,755 100.00% 151,362,417 100.00 %
Less securitization adjustments............................................................ (45,918,984 ) (49,557,390)
Total..................................................................................................... $ 101,017,771 $ 101,805,027