Capital One 2008 Annual Report Download - page 67
Download and view the complete annual report
Please find page 67 of the 2008 Capital One annual report below. You can navigate through the pages in the report by either clicking on the pages listed below, or by using the keyword search tool below to find specific information within the annual report.-
 1
1 -
2
-
3
-
4
-
5
-
6
-
7
-
8
-
9
-
10
-
11
-
12
-
13
-
14
-
15
-
16
-
17
-
18
-
19
-
20
-
21
-
22
-
23
-
24
-
25
-
26
-
27
-
28
-
29
-
30
-
31
-
32
-
33
-
34
-
35
-
36
-
37
-
38
-
39
-
40
-
41
-
42
-
43
-
44
-
45
-
46
-
47
-
48
-
49
-
50
-
51
-
52
-
53
-
54
-
55
-
56
-
 57
57 -
 58
58 -
 59
59 -
 60
60 -
 61
61 -
 62
62 -
 63
63 -
 64
64 -
 65
65 -
 66
66 -
 67
67 -
 68
68 -
 69
69 -
 70
70 -
 71
71 -
 72
72 -
 73
73 -
 74
74 -
 75
75 -
 76
76 -
 77
77 -
78
-
79
-
80
-
81
-
82
-
83
-
84
-
85
-
86
-
87
-
88
-
89
-
90
-
91
-
92
-
93
-
94
-
95
-
96
-
97
-
98
-
99
-
100
-
101
-
102
-
103
-
104
-
105
-
106
-
107
-
108
-
109
-
110
-
111
-
112
-
113
-
114
-
115
-
116
-
117
-
118
-
119
-
120
-
121
-
122
-
123
-
124
-
125
-
126
-
127
-
128
-
129
-
130
-
131
-
132
-
133
-
134
-
135
-
136
-
137
-
138
-
139
-
140
-
141
-
142
-
143
-
144
-
145
-
146
-
147
-
148
-
149
-
150
-
151
-
152
-
153
-
154
-
155
-
156
-
157
-
158
-
159
-
160
-
161
-
162
-
163
-
164
-
165
-
166
-
167
-
168
-
169
-
170
-
171
-
172
-
173
-
174
-
175
-
176
-
177
-
178
-
179
-
180
-
181
-
182
-
183
-
184
-
185
-
186
 |
 |
49
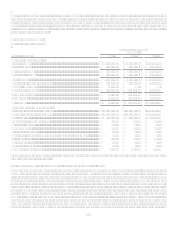
Provision for loan and lease losses
Provision for loan and lease losses increased $2.5 billion, or 93% for the year ended December 31, 2008. The increase in the provision
is a result of continued worsening of the economy which rapidly deteriorated during the later part of 2008 as evidenced by increases in
both the charge-off rate and delinquency rate, rising to 3.51% and 4.37%, respectively, from 2.10% and 3.66%, respectively. The
provision for loan and lease loses increased $1.0 billion in the fourth quarter alone as the Company increased the allowance for loan
and lease losses as the unemployment rate and housing prices showed significant worsening during the fourth quarter of 2008.
Provision for loan and lease losses increased $1.2 billion, or 79% for the year ended December 31, 2007. The increase in provision is a
result of the continued normalization of consumer credit following the unusually favorable credit environment in 2006, adverse
charge-off and delinquency trends in our National Lending businesses and the increase in our coverage ratio of allowance to loans
held for investment as a result of economic weakening in the latter part of 2007 as evidenced by increased delinquency rates and
consistent with recently released economic indicators.
Non-interest expense
Non-interest expense consists of marketing, goodwill impairment and operating expenses.
For the year ended December 31, 2008, non-interest expense, excluding goodwill impairment, decreased 8%. For the year ended
December 31, 2007, non-interest expense increased 16%. See detailed discussion of the components of non-interest expense below.
Marketing
Marketing expenses decreased 17% for the year ended December 31, 2008. The decrease in marketing expenses was due to
selective pull-backs in certain marketing channels and other reductions in response to the changes in the economic environment.
Marketing expenses decreased 7% for the year ended December 31, 2007. The decrease in marketing expenses was due to
selective pull-backs in certain marketing channels.
Goodwill impairment
The Company recorded an impairment to goodwill of $810.9 million, as a result of a reduced estimate of the fair value of the
Auto Finance sub-segment due to business decisions to scale back origination volume in that business. For additional
information, see Section II Critical Accounting Estimates, Valuation of Goodwill and Other Intangible Assets.
Operating Expenses
Operating expenses decreased 7% for the year ended December 31. 2008. The decrease in operating expenses was a direct result
of benefits from the Companys continued cost reduction initiatives.
Operating expenses increased 22% for the year ended December 31. 2007. The increase The increase in operating expense was
driven by the addition of North Forks operating expenses, CDI amortization and integration expenses associated with our bank
acquisitions, litigation accruals related to industry litigation, restructuring charges associated with our cost initiative, and the
accelerated vesting of restricted stock related to the transition to new management in our Local Banking segment.
Income Taxes
The Companys effective tax rate was 85.5%, 33.0% and 33.9% for the years ended December 31, 2008, 2007 and 2006, respectively.
The effective rate includes federal, state, and international tax components. The increase in the 2008 rate compared to the 2007 rate
was primarily due to the non-deductible portion of the goodwill impairment recognized during 2008. The Companys effective tax rate
excluding the goodwill impairment was 37.8%. The decrease in the 2007 rate compared to the 2006 rate was primarily due to changes
in the Companys international tax position recognized in the second quarter 2007 in the amount of $69.0 million and increases in
certain tax credits.
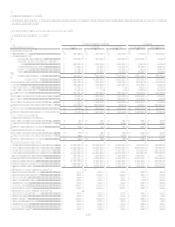
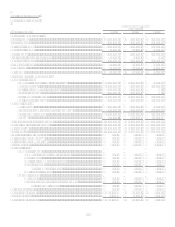
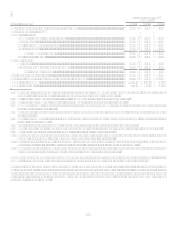
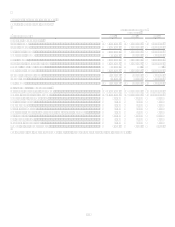
Loan Portfolio Summary
The Company analyzes its financial performance on a managed loan portfolio basis. The managed loan portfolio is comprised of on-
balance sheet and off-balance sheet loans. The Company has retained servicing rights for its securitized loans and receives servicing
fees in addition to the excess spread generated from the off-balance sheet loan portfolio.
Average managed loans held for investment from continuing operations grew $3.1 billion, or 2%, for the year ended December 31,
2008. The modest growth in 2008 was a result of increases in Local Banking and U.S. Card which was mostly offset by reductions in
our International and Auto Finance sub-segments.
Average managed loans held for investment from continuing operations grew $33.4 billion, or 30%, for the year ended December 31,
2007. The increase in average managed loans held for investment during 2007 was due to the North Fork acquisition in late 2006.