Capital One 2008 Annual Report Download - page 96
Download and view the complete annual report
Please find page 96 of the 2008 Capital One annual report below. You can navigate through the pages in the report by either clicking on the pages listed below, or by using the keyword search tool below to find specific information within the annual report.-
 1
1 -
2
-
3
-
4
-
5
-
6
-
7
-
8
-
9
-
10
-
11
-
12
-
13
-
14
-
15
-
16
-
17
-
18
-
19
-
20
-
21
-
22
-
23
-
24
-
25
-
26
-
27
-
28
-
29
-
30
-
31
-
32
-
33
-
34
-
35
-
36
-
37
-
38
-
39
-
40
-
41
-
42
-
43
-
44
-
45
-
46
-
47
-
48
-
49
-
50
-
51
-
52
-
53
-
54
-
55
-
56
-
57
-
58
-
59
-
60
-
61
-
62
-
63
-
64
-
65
-
66
-
67
-
68
-
69
-
70
-
71
-
72
-
73
-
74
-
75
-
76
-
77
-
78
-
79
-
80
-
81
-
82
-
83
-
84
-
85
-
 86
86 -
 87
87 -
 88
88 -
 89
89 -
 90
90 -
 91
91 -
 92
92 -
 93
93 -
 94
94 -
 95
95 -
 96
96 -
 97
97 -
 98
98 -
 99
99 -
 100
100 -
 101
101 -
 102
102 -
 103
103 -
 104
104 -
 105
105 -
 106
106 -
107
-
108
-
109
-
110
-
111
-
112
-
113
-
114
-
115
-
116
-
117
-
118
-
119
-
120
-
121
-
122
-
123
-
124
-
125
-
126
-
127
-
128
-
129
-
130
-
131
-
132
-
133
-
134
-
135
-
136
-
137
-
138
-
139
-
140
-
141
-
142
-
143
-
144
-
145
-
146
-
147
-
148
-
149
-
150
-
151
-
152
-
153
-
154
-
155
-
156
-
157
-
158
-
159
-
160
-
161
-
162
-
163
-
164
-
165
-
166
-
167
-
168
-
169
-
170
-
171
-
172
-
173
-
174
-
175
-
176
-
177
-
178
-
179
-
180
-
181
-
182
-
183
-
184
-
185
-
186
 |
 |

78
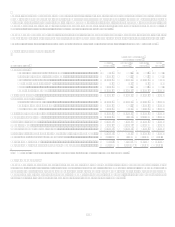
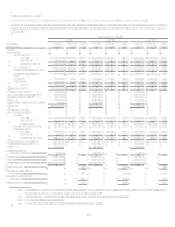
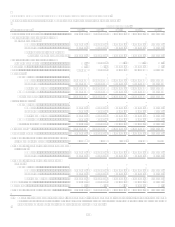
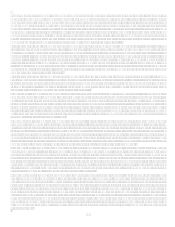
TABLE FNET CHARGE-OFFS
Table F shows the Companys net charge-offs for the periods presented on a reported and managed basis.
Year Ended December 31
(Dollars in thousands)
2008(1)
2007(1)
2006
2005
2004
Reported:
Average loans held for investment........ $ 98,970,903
$ 93,541,825 $ 63,577,279 $ 40,734,237 $ 34,265,668
Net charge-offs ..................................... 3,478,171
1,960,541 1,407,489 1,446,649 1,295,568
Net charge-offs as a percentage of
average loans held for investment.... 3.51% 2.10% 2.21% 3.55% 3.78%
Managed:
Average loans held for investment........ $ 147,812,266 $ 144,727,007 $ 111,328,595 $ 85,265,023 $ 73,711,673
Net charge-offs ..................................... 6,424,937
4,161,995 3,158,080 3,623,154 3,251,761
Net charge-offs as a percentage of
average loans held for investment.... 4.35% 2.88% 2.84% 4.25% 4.41%
(1) Based on continuing operations.
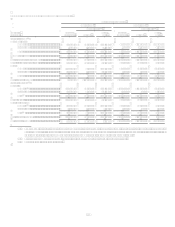
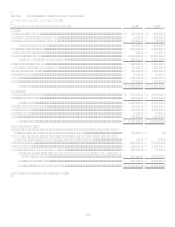
TABLE GNONPERFORMING ASSETS
Table G shows a summary of nonperforming assets for the periods indicated.
As of December 31
(Dollars in thousands)
2008
2007(2)
2006(2)
2005(2)
Nonperforming loans held for investment(1):
Commercial lending..........................................................
Commercial and multi-family real estate ................ $ 142,261
$ 29,391 $ 13,745 $ 7,800
Middle market ......................................................... 38,677
28,772 10,820 50,957
Small ticket commercial real estate......................... 167,467
16,026 237
Specialty lending..................................................... 37,217
6,086 226
Total commercial lending ................................................. 385,622
80,275 25,028 58,757
Small business lending...................................................... 75,619
42,490 32,563 29,292
Total commercial & small business lending ..................... 461,241
122,765 57,591 88,049
Consumer auto ............................................................... 164,646
156,580 86,943 61,053
Consumer real estate...................................................... 178,414
113,831 21,762 17,340
Consumer other.............................................................. 51
137 264 217
Total nonperforming loans held for investment................ 804,352
393,313 166,560 166,659
Foreclosed property .......................................................... 88,961
48,016 16,146 8,436
Repossessed assets............................................................ 65,635
56,877 30,844 22,917
Total nonperforming assets............................................... $ 958,948
$ 498,206 $ 213,550 $ 198,012
(1) Our policy is not to classify credit card loans as nonperforming loans. Credit card loans continue to accrue finance charges and
fees until charged-off at 180-days.
(2) Certain prior period amounts have been reclassified to conform to current period presentation.