Capital One 2008 Annual Report Download - page 170
Download and view the complete annual report
Please find page 170 of the 2008 Capital One annual report below. You can navigate through the pages in the report by either clicking on the pages listed below, or by using the keyword search tool below to find specific information within the annual report.-
 1
1 -
2
-
3
-
4
-
5
-
6
-
7
-
8
-
9
-
10
-
11
-
12
-
13
-
14
-
15
-
16
-
17
-
18
-
19
-
20
-
21
-
22
-
23
-
24
-
25
-
26
-
27
-
28
-
29
-
30
-
31
-
32
-
33
-
34
-
35
-
36
-
37
-
38
-
39
-
40
-
41
-
42
-
43
-
44
-
45
-
46
-
47
-
48
-
49
-
50
-
51
-
52
-
53
-
54
-
55
-
56
-
57
-
58
-
59
-
60
-
61
-
62
-
63
-
64
-
65
-
66
-
67
-
68
-
69
-
70
-
71
-
72
-
73
-
74
-
75
-
76
-
77
-
78
-
79
-
80
-
81
-
82
-
83
-
84
-
85
-
86
-
87
-
88
-
89
-
90
-
91
-
92
-
93
-
94
-
95
-
96
-
97
-
98
-
99
-
100
-
101
-
102
-
103
-
104
-
105
-
106
-
107
-
108
-
109
-
110
-
111
-
112
-
113
-
114
-
115
-
116
-
117
-
118
-
119
-
120
-
121
-
122
-
123
-
124
-
125
-
126
-
127
-
128
-
129
-
130
-
131
-
132
-
133
-
134
-
135
-
136
-
137
-
138
-
139
-
140
-
141
-
142
-
143
-
144
-
145
-
146
-
147
-
148
-
149
-
150
-
151
-
152
-
153
-
154
-
155
-
156
-
157
-
158
-
159
-
 160
160 -
 161
161 -
 162
162 -
 163
163 -
 164
164 -
 165
165 -
 166
166 -
 167
167 -
 168
168 -
 169
169 -
 170
170 -
 171
171 -
 172
172 -
 173
173 -
 174
174 -
 175
175 -
 176
176 -
 177
177 -
 178
178 -
 179
179 -
 180
180 -
181
-
182
-
183
-
184
-
185
-
186
 |
 |

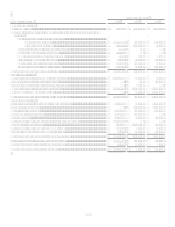
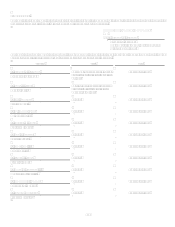
152
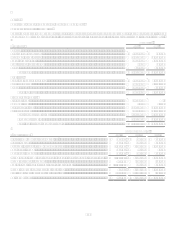
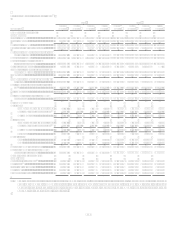
Year Ended December 31
Statements of Cash Flows
2008
2007
2006
Operating Activities:
Net income (loss)........................................................................................................ $ (45,998) $ 1,570,332 $ 2,414,493
Adjustments to reconcile net income (loss) to net cash provided by operating
activities:
Equity in (earnings) loss of subsidiaries:...........................................................
Continuing operations.............................................................................. 1,289,184 (723,020) (475,123)
Discontinued operations .......................................................................... 130,515
1,021,387 11,884
Loss on sale of securities available for sale....................................................... 9,353
223
Gain on repurchase of senior notes ................................................................... (43,249)
Amortization of discount of senior notes .......................................................... 2,864
7,293 1,347
Stock plan compensation expense ..................................................................... 59,283
301,972 212,317
Decrease (increase) in other assets .................................................................... 106,782
(216,052) 19,159
Increase (decrease) in other liabilities ............................................................... 673,561
522,714 (448,363)
Net cash provided by operating activities ................................................................... 2,182,295 2,484,849 1,735,714
Investing Activities:
Decrease (increase) in investment in subsidiaries....................................................... (1,384,682) 969,122 68,953
Purchases of securities available for sale ....................................................................
(127) (52,686)
Proceeds from sale of securities available for sale......................................................
53,569
Decrease (increase) in loans to subsidiaries................................................................ 5,414,902
(1,930,666) (1,065,622)
Net payment for companies acquired..........................................................................
(10,464) (5,010,821)
Net cash provided by (used in) investing activities..................................................... 4,030,220 (918,566) (6,060,176)
Financing Activities:
Increase (decrease) in borrowings from subsidiaries .................................................. (268,347) 166,876 1,379,497
Issuance of senior notes ..............................................................................................
1,495,740 3,185,588
Maturities of senior notes............................................................................................ (550,000) (462,500) (225,000)
Repurchases of senior notes........................................................................................ (713,383) (150,000)
Dividends paid ............................................................................................................ (568,255) (42,055) (32,324)
Net proceeds from issuance of preferred stock and warrant ....................................... 3,555,199
Purchases of treasury stock......................................................................................... (12,501) (3,024,969) (21,615)
Net proceeds from issuances of common stock .......................................................... 772,017
43,493 36,751
Proceeds from share based payment activities............................................................ 95,048
192,361 238,355
Net cash provided by (used in) financing activities .................................................... 2,309,778 (1,781,054) 4,561,252
Increase (decrease) in cash and cash equivalents........................................................ 8,522,293 (214,771) 236,790
Cash and cash equivalents at beginning of year.......................................................... 24,702
239,473 2,683
Cash and cash equivalents at end of year.................................................................... $ 8,546,995 $ 24,702 $ 239,473