Capital One 2008 Annual Report Download - page 97
Download and view the complete annual report
Please find page 97 of the 2008 Capital One annual report below. You can navigate through the pages in the report by either clicking on the pages listed below, or by using the keyword search tool below to find specific information within the annual report.-
 1
1 -
2
-
3
-
4
-
5
-
6
-
7
-
8
-
9
-
10
-
11
-
12
-
13
-
14
-
15
-
16
-
17
-
18
-
19
-
20
-
21
-
22
-
23
-
24
-
25
-
26
-
27
-
28
-
29
-
30
-
31
-
32
-
33
-
34
-
35
-
36
-
37
-
38
-
39
-
40
-
41
-
42
-
43
-
44
-
45
-
46
-
47
-
48
-
49
-
50
-
51
-
52
-
53
-
54
-
55
-
56
-
57
-
58
-
59
-
60
-
61
-
62
-
63
-
64
-
65
-
66
-
67
-
68
-
69
-
70
-
71
-
72
-
73
-
74
-
75
-
76
-
77
-
78
-
79
-
80
-
81
-
82
-
83
-
84
-
85
-
86
-
 87
87 -
 88
88 -
 89
89 -
 90
90 -
 91
91 -
 92
92 -
 93
93 -
 94
94 -
 95
95 -
 96
96 -
 97
97 -
 98
98 -
 99
99 -
 100
100 -
 101
101 -
 102
102 -
 103
103 -
 104
104 -
 105
105 -
 106
106 -
 107
107 -
108
-
109
-
110
-
111
-
112
-
113
-
114
-
115
-
116
-
117
-
118
-
119
-
120
-
121
-
122
-
123
-
124
-
125
-
126
-
127
-
128
-
129
-
130
-
131
-
132
-
133
-
134
-
135
-
136
-
137
-
138
-
139
-
140
-
141
-
142
-
143
-
144
-
145
-
146
-
147
-
148
-
149
-
150
-
151
-
152
-
153
-
154
-
155
-
156
-
157
-
158
-
159
-
160
-
161
-
162
-
163
-
164
-
165
-
166
-
167
-
168
-
169
-
170
-
171
-
172
-
173
-
174
-
175
-
176
-
177
-
178
-
179
-
180
-
181
-
182
-
183
-
184
-
185
-
186
 |
 |

79
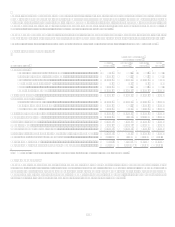
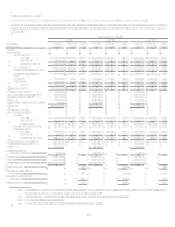
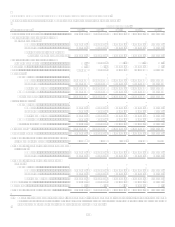
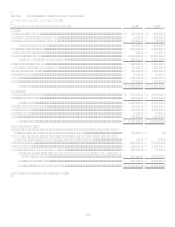
TABLE HSUMMARY OF ALLOWANCE FOR LOAN AND LEASE LOSSES
Table H sets forth activity in the allowance for loan and lease losses for the periods indicated.
Year Ended December 31
(Dollars In Thousands)
2008
2007
2006
2005
2004
Balance at beginning of year...................................$ 2,963,000 $ 2,180,000 $ 1,790,000 $ 1,505,000 $ 1,595,000
Provision for loan and lease losses from
continuing operations:
Domestic .............................................. 4,873,553 2,487,694 1,235,984 1,327,968 1,085,467
International......................................... 227,487 148,808 240,454 163,104 135,385
Total provision for loan and lease
losses from continuing operations... 5,101,040
2,636,502 1,476,438 1,491,072 1,220,852
Provision for loan and lease losses from
discontinued operations......................................
80,151
Acquisitions ............................................................ 225,890 224,144
Other ....................................................................... (61,909) 26,888 72,821 (12,731) (15,284)
Charge-offs:
Consumer loans:............................................
Domestic .............................................. (3,340,572) (2,076,794) (1,547,746) (1,532,499) (1,473,103)
International......................................... (255,145) (252,444) (249,332) (193,360) (135,198)
Total consumer loans ........................... (3,595,717) (2,329,238) (1,797,078) (1,725,859) (1,608,301)
Commercial loans.......................................... (555,514) (250,981) (135,375) (139,977) (140,972)
Total charge-offs ........................................... (4,151,231) (2,580,219) (1,932,453) (1,865,836) (1,749,273)
Principal recoveries:
Consumer loans.............................................
Domestic .............................................. 547,025 503,618 451,781 384,266 388,573
International......................................... 65,041 71,868 68,280 43,560 43,212
Total consumer loans ........................... 612,066 575,486 520,061 427,826 431,785
Commercial loans.......................................... 60,994 44,192 27,243 20,525 21,920
Total principal recoveries.............................. 673,060 619,678 547,304 448,351 453,705
Net charge-offs(1) ..................................................... (3,478,171) (1,960,541) (1,385,149) (1,417,485) (1,295,568)
Balance at end of year.............................................$ 4,523,960 $ 2,963,000 $ 2,180,000 $ 1,790,000 $ 1,505,000
Allowance for loan and lease losses to loans held
for investment at end of year.............................. 4.48% 2.91% 2.26% 2.99% 3.94%
Allowance for loan and lease losses by geographic
distribution:
Domestic ..............................................$ 4,330,864 $ 2,754,065 $ 1,949,864 $ 1,639,277 $ 1,354,849
International......................................... 193,096 208,935 230,136 150,723 150,151
Allowance for loan and lease losses by loan
category:
Consumer loans:............................................
Domestic ..............................................$ 3,414,910 $ 2,199,788 $ 1,584,025 $ 1,405,909 $ 1,222,083
International......................................... 193,096 208,935 230,136 150,723 150,151
Total consumer loans ........................... 3,608,006 2,408,723 1,814,161 1,556,632 1,372,234
Commercial loans ................................................... 915,954 554,277 365,839 221,975 132,766
Unallocated ............................................................. 11,393
Allowance for loan and lease losses .......................$ 4,523,960 $ 2,963,000 $ 2,180,000 $ 1,790,000 $ 1,505,000
(1) Does not include charge-offs of $22.3 million and $29.2 million in 2006 and 2005, respectively, relating to certain loans which
were segregated into pools apart from the remaining portfolio and accounted for under Statement of Position 03-3, Accounting
for Certain Loans or Debt Securities Acquired in a Transfer (SOP 03-3).