Capital One 2008 Annual Report Download - page 74
Download and view the complete annual report
Please find page 74 of the 2008 Capital One annual report below. You can navigate through the pages in the report by either clicking on the pages listed below, or by using the keyword search tool below to find specific information within the annual report.-
 1
1 -
2
-
3
-
4
-
5
-
6
-
7
-
8
-
9
-
10
-
11
-
12
-
13
-
14
-
15
-
16
-
17
-
18
-
19
-
20
-
21
-
22
-
23
-
24
-
25
-
26
-
27
-
28
-
29
-
30
-
31
-
32
-
33
-
34
-
35
-
36
-
37
-
38
-
39
-
40
-
41
-
42
-
43
-
44
-
45
-
46
-
47
-
48
-
49
-
50
-
51
-
52
-
53
-
54
-
55
-
56
-
57
-
58
-
59
-
60
-
61
-
62
-
63
-
 64
64 -
 65
65 -
 66
66 -
 67
67 -
 68
68 -
 69
69 -
 70
70 -
 71
71 -
 72
72 -
 73
73 -
 74
74 -
 75
75 -
 76
76 -
 77
77 -
 78
78 -
 79
79 -
 80
80 -
 81
81 -
 82
82 -
 83
83 -
 84
84 -
85
-
86
-
87
-
88
-
89
-
90
-
91
-
92
-
93
-
94
-
95
-
96
-
97
-
98
-
99
-
100
-
101
-
102
-
103
-
104
-
105
-
106
-
107
-
108
-
109
-
110
-
111
-
112
-
113
-
114
-
115
-
116
-
117
-
118
-
119
-
120
-
121
-
122
-
123
-
124
-
125
-
126
-
127
-
128
-
129
-
130
-
131
-
132
-
133
-
134
-
135
-
136
-
137
-
138
-
139
-
140
-
141
-
142
-
143
-
144
-
145
-
146
-
147
-
148
-
149
-
150
-
151
-
152
-
153
-
154
-
155
-
156
-
157
-
158
-
159
-
160
-
161
-
162
-
163
-
164
-
165
-
166
-
167
-
168
-
169
-
170
-
171
-
172
-
173
-
174
-
175
-
176
-
177
-
178
-
179
-
180
-
181
-
182
-
183
-
184
-
185
-
186
 |
 |

56
Company closed approximately 2 million inactive accounts during the second quarter of 2008. See below for a detailed discussion of
the results of the U.S. Card, Auto Finance and International sub-segments.
Year Ended December 31, 2007 Compared to Year Ended December 31, 2006
The National Lending segment contributed $2.4 billion of net income during 2007, compared to $2.3 billion during 2006. At
December 31 2007, loans outstanding in the National Lending segment totaled $106.5 billion while deposits outstanding totaled $2.1
billion. Profits are primarily generated from net interest income, which includes past-due fees earned and deemed collectible from our
loans, and non-interest income, which includes fee-based services to customers. Total revenue increased 12% during 2007 primarily
due to growth in the average managed loans held for investment portfolio of 7% and selective pricing and fee changes following
conversion of our cardholder system. Provision for loan and lease losses increased $1.5 billion, or 46%, during 2007, compared to
2006 due to normalization of credit following the unusually favorable credit environment in 2006, selective pricing and fee policy
moves in the U.S. Card sub-segment, the significant pull back from prime revolver marketing in the U.S. Card sub-segment, continued
elevated losses in the Auto Finance sub-segment, and from economic weakening consistent with recently released economic
indicators.
U.S. Card Sub-Segment
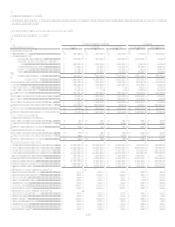
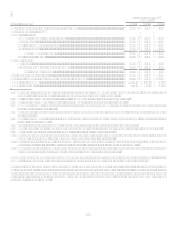
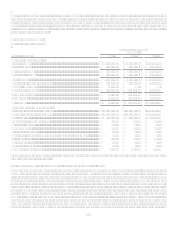
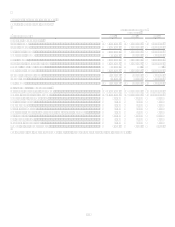
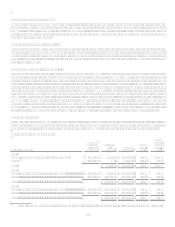
Table 4: U.S. Card
As of and for the Year Ended
December 31,
(Dollars in thousands)
2008
2007
2006
Earnings (Managed Basis)
Interest income.............................................................................................
.
$ 8,986,301 $ 9,407,355 $ 8,313,110
Interest expense............................................................................................
.
2,494,215 3,135,436 2,773,610
Net interest income.......................................................................................
.
6,492,086 6,271,919 5,539,500
Non-interest income .....................................................................................
.
4,127,615 4,136,158 3,700,765
Total revenue................................................................................................
.
10,619,701 10,408,077 9,240,265
Provision for loan and lease losses...............................................................
.
5,460,986 3,033,217 2,016,476
Non-interest expense....................................................................................
.
3,618,639 3,934,574 4,100,966
Income before taxes .....................................................................................
.
1,540,076 3,440,286 3,122,823
Income taxes.................................................................................................
.
539,026 1,183,458 1,093,289
Net income ...................................................................................................
.
$ 1,001,050 $ 2,256,828 $ 2,029,534
Selected Metrics (Managed Basis)
Period end loans held for investment ...........................................................
.
$ 70,944,581 $ 69,723,169 $ 68,856,534
Average loans held for investment...............................................................
.
$ 68,634,756 $ 66,774,914 $ 63,774,470
Loans held for investment yield ...................................................................
.
13.09% 14.09% 13.04%
Net interest margin .......................................................................................
.
9.46% 9.39% 8.69%
Revenue margin............................................................................................
.
15.47% 15.59% 14.49%
Risk adjusted margin....................................................................................
.
9.14% 11.59% 11.37%
Non-interest expense as a % of average loans held for investment..............
.
5.27% 5.89% 6.43%
Efficiency ratio.............................................................................................
.
34.07% 37.80% 44.38%
Net charge-off rate .......................................................................................
.
6.33% 4.00% 3.12%
30+ day delinquency rate .............................................................................
.
4.78% 4.28% 3.30%
Purchase Volume(1) .......................................................................................
.
$ 103,035,146 $ 105,875,472 $ 102,079,717
Number of total accounts (000s) ..................................................................
.
37,436 41,044 42,174
(1) Includes purchase transactions net of returns and excludes cash advance transactions.
The U.S. Card sub-segment consists of domestic consumer credit card lending, national small business lending, installment loans and
other unsecured consumer financial service activities.