Capital One 2008 Annual Report Download - page 125
Download and view the complete annual report
Please find page 125 of the 2008 Capital One annual report below. You can navigate through the pages in the report by either clicking on the pages listed below, or by using the keyword search tool below to find specific information within the annual report.-
 1
1 -
2
-
3
-
4
-
5
-
6
-
7
-
8
-
9
-
10
-
11
-
12
-
13
-
14
-
15
-
16
-
17
-
18
-
19
-
20
-
21
-
22
-
23
-
24
-
25
-
26
-
27
-
28
-
29
-
30
-
31
-
32
-
33
-
34
-
35
-
36
-
37
-
38
-
39
-
40
-
41
-
42
-
43
-
44
-
45
-
46
-
47
-
48
-
49
-
50
-
51
-
52
-
53
-
54
-
55
-
56
-
57
-
58
-
59
-
60
-
61
-
62
-
63
-
64
-
65
-
66
-
67
-
68
-
69
-
70
-
71
-
72
-
73
-
74
-
75
-
76
-
77
-
78
-
79
-
80
-
81
-
82
-
83
-
84
-
85
-
86
-
87
-
88
-
89
-
90
-
91
-
92
-
93
-
94
-
95
-
96
-
97
-
98
-
99
-
100
-
101
-
102
-
103
-
104
-
105
-
106
-
107
-
108
-
109
-
110
-
111
-
112
-
113
-
114
-
 115
115 -
 116
116 -
 117
117 -
 118
118 -
 119
119 -
 120
120 -
 121
121 -
 122
122 -
 123
123 -
 124
124 -
 125
125 -
 126
126 -
 127
127 -
 128
128 -
 129
129 -
 130
130 -
 131
131 -
 132
132 -
 133
133 -
 134
134 -
 135
135 -
136
-
137
-
138
-
139
-
140
-
141
-
142
-
143
-
144
-
145
-
146
-
147
-
148
-
149
-
150
-
151
-
152
-
153
-
154
-
155
-
156
-
157
-
158
-
159
-
160
-
161
-
162
-
163
-
164
-
165
-
166
-
167
-
168
-
169
-
170
-
171
-
172
-
173
-
174
-
175
-
176
-
177
-
178
-
179
-
180
-
181
-
182
-
183
-
184
-
185
-
186
 |
 |

107
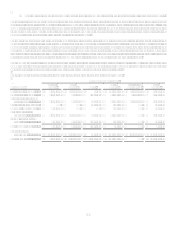
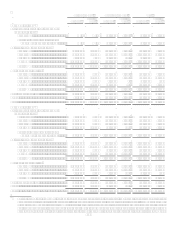
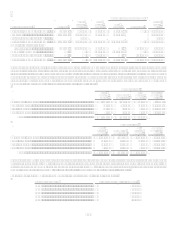
Weighted Average Yields
1 Year
or Less
15
Years
510
Years
Over 10
Years
Collateralized mortgage obligations
Fannie Mae.................................................................................................................
.
5.15 5.32 5.28
Freddie Mac................................................................................................................
.
4.28 5.16 5.42
Other GSE ..................................................................................................................
.
4.92
Non GSE ....................................................................................................................
.
5.76 5.57 5.30 6.58
Total CMO .................................................................................................................
.
4.98 5.32 5.38 6.58
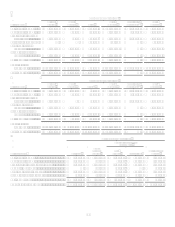
Mortgage backed securities
Fannie Mae.................................................................................................................
.
5.39 5.87 5.15
Freddie Mac................................................................................................................
.
7.45 5.60 5.00
Other GSE ..................................................................................................................
.
6.30 6.09 5.56
Non GSE ....................................................................................................................
.
5.89
Total MBS..................................................................................................................
.
5.52 5.81 5.17
Asset backed securities ........................................................................................................
.
4.77 4.88 5.01
Other ....................................................................................................................................
.
4.57 4.20 4.54 4.98
Total.....................................................................................................................................
.
4.75 % 5.42% 5.08% 5.06 %
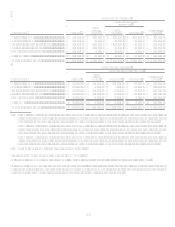
December 31, 2006(1)
U.S. Treasury and other U.S. government agency obligations
U.S. Treasury..............................................................................................................
.
% 4.06% 4.27% %
Fannie Mae.................................................................................................................
.
3.67 4.86 4.43
Freddie Mac................................................................................................................
.
3.41 4.72 4.59
Other GSE ..................................................................................................................
.
3.67 4.78 5.44
Total U.S. Treasury and other U.S. government agency obligations .........................
.
3.58 4.75 4.42 5.44
Collateralized mortgage obligations
Fannie Mae.................................................................................................................
.
5.22 5.20 5.35
Freddie Mac................................................................................................................
.
5.28 5.11 5.43
Other GSE ..................................................................................................................
.
5.13 5.39
Non GSE ....................................................................................................................
.
4.44 5.14 4.81 4.82
Total CMO .................................................................................................................
.
5.08 5.14 5.34 4.82
Mortgage backed securities
Fannie Mae.................................................................................................................
.
6.48 5.76 5.66 6.28
Freddie Mac................................................................................................................
.
7.62 5.33 5.03
Other GSE ..................................................................................................................
.
4.83 5.34 5.85 3.41
Total MBS..................................................................................................................
.
4.92 5.69 5.45 5.87
Asset backed securities ........................................................................................................
.
4.47 4.87 5.60
Other ....................................................................................................................................
.
4.12 3.82 3.83 5.17
Total.....................................................................................................................................
.
4.03 % 5.21% 5.10% 5.24 %
(1) Certain information disclosed for the years ended December 31, 2007, and 2006 has been revised in these tables from the
versions that appeared in prior 10-Ks to reflect a change in methodology to certain weighted average yield information and to
reclassify securities among investment categories and to make certain other immaterial changes. Weighted Average Yields have
been recalculated using different prepayment assumptions, resulting in a more precise weighted average remaining life for our
investments. For the year ended December 31, 2006, the Company used median prepayment speed projections obtained from a
number of dealers which resulted in longer weighted average remaining life. For the year ended December 31, 2007, the
Company used expected yield to maturity instead of average book yield.