Capital One 2008 Annual Report Download - page 76
Download and view the complete annual report
Please find page 76 of the 2008 Capital One annual report below. You can navigate through the pages in the report by either clicking on the pages listed below, or by using the keyword search tool below to find specific information within the annual report.-
 1
1 -
2
-
3
-
4
-
5
-
6
-
7
-
8
-
9
-
10
-
11
-
12
-
13
-
14
-
15
-
16
-
17
-
18
-
19
-
20
-
21
-
22
-
23
-
24
-
25
-
26
-
27
-
28
-
29
-
30
-
31
-
32
-
33
-
34
-
35
-
36
-
37
-
38
-
39
-
40
-
41
-
42
-
43
-
44
-
45
-
46
-
47
-
48
-
49
-
50
-
51
-
52
-
53
-
54
-
55
-
56
-
57
-
58
-
59
-
60
-
61
-
62
-
63
-
64
-
65
-
 66
66 -
 67
67 -
 68
68 -
 69
69 -
 70
70 -
 71
71 -
 72
72 -
 73
73 -
 74
74 -
 75
75 -
 76
76 -
 77
77 -
 78
78 -
 79
79 -
 80
80 -
 81
81 -
 82
82 -
 83
83 -
 84
84 -
 85
85 -
 86
86 -
87
-
88
-
89
-
90
-
91
-
92
-
93
-
94
-
95
-
96
-
97
-
98
-
99
-
100
-
101
-
102
-
103
-
104
-
105
-
106
-
107
-
108
-
109
-
110
-
111
-
112
-
113
-
114
-
115
-
116
-
117
-
118
-
119
-
120
-
121
-
122
-
123
-
124
-
125
-
126
-
127
-
128
-
129
-
130
-
131
-
132
-
133
-
134
-
135
-
136
-
137
-
138
-
139
-
140
-
141
-
142
-
143
-
144
-
145
-
146
-
147
-
148
-
149
-
150
-
151
-
152
-
153
-
154
-
155
-
156
-
157
-
158
-
159
-
160
-
161
-
162
-
163
-
164
-
165
-
166
-
167
-
168
-
169
-
170
-
171
-
172
-
173
-
174
-
175
-
176
-
177
-
178
-
179
-
180
-
181
-
182
-
183
-
184
-
185
-
186
 |
 |

58
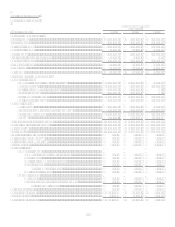
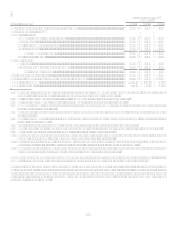
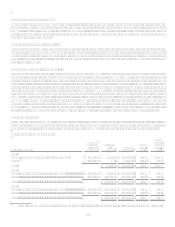
Other National Lending Sub-Segment
Table 5: Other National Lending
As of and for the Year Ended
December 31,
(Dollars in thousands)
2008
2007
2006
Earnings (Managed Basis)
Interest income...................................................................................................
.
$ 4,081,704 $ 4,268,331 $ 3,757,418
Interest expense..................................................................................................
.
1,582,916 1,699,014 1,400,784
Net interest income.............................................................................................
.
2,498,788 2,569,317 2,356,634
Non-interest income ...........................................................................................
.
609,997 734,569 674,361
Total revenue......................................................................................................
.
3,108,785 3,303,886 3,030,995
Provision for loan and lease losses.....................................................................
.
1,967,490 1,658,470 1,191,170
Goodwill impairment charge..............................................................................
.
810,876
Non-interest expense..........................................................................................
.
1,275,259 1,485,630 1,428,138
Income (loss) before taxes..................................................................................
.
(944,840) 159,786 411,687
Income taxes.......................................................................................................
.
(53,761) 53,705 147,319
Net income .........................................................................................................
.
$ (891,079) $ 106,081 $ 264,368
Selected Metrics (Managed Basis)
Period end loans held for investment .................................................................
.
$ 30,202,553 $ 36,785,274 $ 33,502,646
Average loans held for investment.....................................................................
.
$ 34,054,497 $ 35,460,470 $ 31,695,965
Loans held for investment yield .........................................................................
.
11.99% 12.04% 11.85%
Net interest margin .............................................................................................
.
7.34% 7.25% 7.44%
Revenue margin..................................................................................................
.
9.13% 9.32% 9.56%
Risk adjusted margin..........................................................................................
.
4.17% 5.44% 6.08%
Non-interest expense as a % of average loans held for investment....................
.
3.74% 4.19% 4.51%
Efficiency ratio...................................................................................................
.
41.02% 44.97% 47.12%
Net charge-off rate .............................................................................................
.
4.96% 3.88% 3.49%
30+ day delinquency rate ...................................................................................
.
8.64% 8.03% 5.72%
Number of total accounts (000s) ........................................................................
.
7,381 7,493 7,199
The Other National Lending sub-segment consists of the Auto Finance and International sub-segments.