Sallie Mae 2013 Annual Report Download - page 98
Download and view the complete annual report
Please find page 98 of the 2013 Sallie Mae annual report below. You can navigate through the pages in the report by either clicking on the pages listed below, or by using the keyword search tool below to find specific information within the annual report.-
 1
1 -
2
-
3
-
4
-
5
-
6
-
7
-
8
-
9
-
10
-
11
-
12
-
13
-
14
-
15
-
16
-
17
-
18
-
19
-
20
-
21
-
22
-
23
-
24
-
25
-
26
-
27
-
28
-
29
-
30
-
31
-
32
-
33
-
34
-
35
-
36
-
37
-
38
-
39
-
40
-
41
-
42
-
43
-
44
-
45
-
46
-
47
-
48
-
49
-
50
-
51
-
52
-
53
-
54
-
55
-
56
-
57
-
58
-
59
-
60
-
61
-
62
-
63
-
64
-
65
-
66
-
67
-
68
-
69
-
70
-
71
-
72
-
73
-
74
-
75
-
76
-
77
-
78
-
79
-
80
-
81
-
82
-
83
-
84
-
85
-
86
-
87
-
 88
88 -
 89
89 -
 90
90 -
 91
91 -
 92
92 -
 93
93 -
 94
94 -
 95
95 -
 96
96 -
 97
97 -
 98
98 -
 99
99 -
 100
100 -
 101
101 -
 102
102 -
 103
103 -
 104
104 -
 105
105 -
 106
106 -
 107
107 -
 108
108 -
109
-
110
-
111
-
112
-
113
-
114
-
115
-
116
-
117
-
118
-
119
-
120
-
121
-
122
-
123
-
124
-
125
-
126
-
127
-
128
-
129
-
130
-
131
-
132
-
133
-
134
-
135
-
136
-
137
-
138
-
139
-
140
-
141
-
142
-
143
-
144
-
145
-
146
-
147
-
148
-
149
-
150
-
151
-
152
-
153
-
154
-
155
-
156
-
157
-
158
-
159
-
160
-
161
-
162
-
163
-
164
-
165
-
166
-
167
-
168
-
169
-
170
-
171
-
172
-
173
-
174
-
175
-
176
-
177
-
178
-
179
-
180
-
181
-
182
-
183
-
184
-
185
-
186
-
187
-
188
-
189
-
190
-
191
-
192
-
193
-
194
-
195
-
196
-
197
-
198
-
199
-
200
-
201
-
202
-
203
-
204
-
205
-
206
-
207
-
208
-
209
-
210
-
211
-
212
-
213
-
214
-
215
-
216
-
217
-
218
-
219
-
220
-
221
-
222
-
223
-
224
-
225
-
226
-
227
-
228
-
229
-
230
-
231
-
232
 |
 |

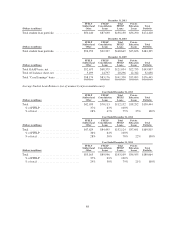
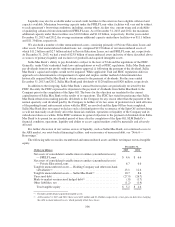
December 31, 2010 December 31, 2009
(Dollars in millions) Traditional
Non-
Traditional Total Traditional
Non-
Traditional Total
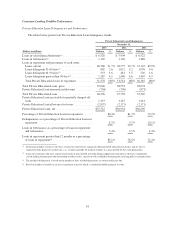
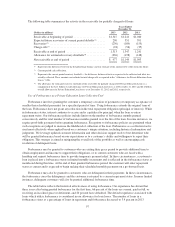
Ending total loans(1) .................. $34,177 $4,395 $38,572 $33,223 $4,747 $37,970
Ending loans in repayment ............. 25,043 2,809 27,852 21,453 2,913 24,366
Private Education Loan allowance for loan
losses ............................ 1,231 791 2,022 1,056 911 1,967
Charge-offs as a percentage of average
loans in repayment ................. 3.6% 16.8% 5.0% 3.6% 21.4% 6.0%
Allowance as a percentage of ending total
loans ............................ 3.6% 18.0% 5.2% 3.2% 19.2% 5.2%
Allowance as a percentage of ending loans
in repayment ...................... 4.9% 28.2% 7.3% 4.9% 31.3% 8.1%
Allowance coverage of charge-offs ...... 1.5 1.7 1.6 1.6 1.5 1.5
Delinquencies as a percentage of Private
Education Loans in repayment ........ 8.8% 27.4% 10.6% 9.5% 31.4% 12.1%
Delinquencies greater than 90 days as a
percentage of Private Education Loans
in repayment ...................... 4.2% 15.0% 5.3% 4.6% 17.5% 6.1%
Loans in forbearance as a percentage of
loans in repayment and forbearance .... 4.4% 6.1% 4.6% 5.3% 7.1% 5.5%
Loans that entered repayment during the
period(2) .......................... $ 6,451 $ 553 $ 7,004 $ 6,430 $ 851 $ 7,281
Percentage of Private Education Loans
with a cosigner .................... 63% 28% 59% 61% 28% 57%
Average FICO at origination ........... 725 623 715 725 623 713
(1) Ending total loans represent gross Private Education Loans, plus the receivable for partially charged-off loans.
(2) Includes loans that are required to make a payment for the first time.
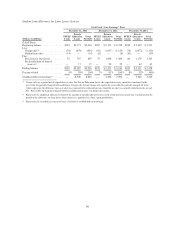
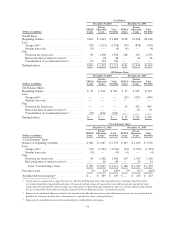
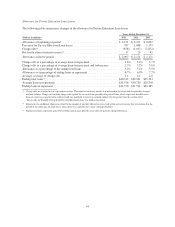
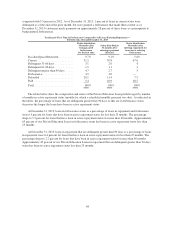
As part of concluding on the adequacy of the allowance for loan losses, we review key allowance and loan
metrics. The most significant of these metrics considered are the allowance coverage of charge-offs ratio; the
allowance as a percentage of total loans and of loans in repayment; and delinquency and forbearance percentages.
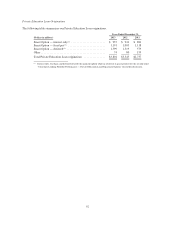
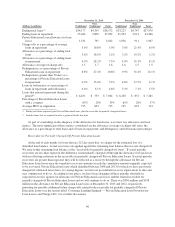
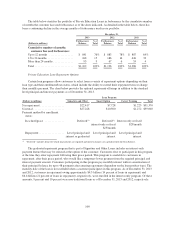
Receivable for Partially Charged-Off Private Education Loans
At the end of each month, for loans that are 212 days past due, we charge off the estimated loss of a
defaulted loan balance. Actual recoveries are applied against the remaining loan balance that was not charged off.
We refer to this remaining loan balance as the “receivable for partially charged-off loans.” If actual periodic
recoveries are less than expected, the difference is immediately charged off through the allowance for loan losses
with an offsetting reduction in the receivable for partially charged-off Private Education Loans. If actual periodic
recoveries are greater than expected, they will be reflected as a recovery through the allowance for Private
Education Loan losses once the cumulative recovery amount exceeds the cumulative amount originally expected
to be recovered. Private Education Loans which defaulted between 2008 and 2013 for which we have previously
charged off estimated losses have, to varying degrees, not met our post-default recovery expectations to date and
may continue not to do so. According to our policy, we have been charging off these periodic shortfalls in
expected recoveries against our allowance for Private Education Loan losses and the related receivable for
partially charged-off Private Education Loans and we will continue to do so. There was $336 million and $198
million in the allowance for Private Education Loan losses at December 31, 2013 and 2012, respectively,
providing for possible additional future charge-offs related to the receivable for partially charged-off Private
Education Loans (see the section titled “Consumer Lending Segment — Private Education Loan Provision for
Loan Losses and Charge-Offs” for a further discussion).
96