Sallie Mae 2013 Annual Report Download - page 112
Download and view the complete annual report
Please find page 112 of the 2013 Sallie Mae annual report below. You can navigate through the pages in the report by either clicking on the pages listed below, or by using the keyword search tool below to find specific information within the annual report.-
 1
1 -
2
-
3
-
4
-
5
-
6
-
7
-
8
-
9
-
10
-
11
-
12
-
13
-
14
-
15
-
16
-
17
-
18
-
19
-
20
-
21
-
22
-
23
-
24
-
25
-
26
-
27
-
28
-
29
-
30
-
31
-
32
-
33
-
34
-
35
-
36
-
37
-
38
-
39
-
40
-
41
-
42
-
43
-
44
-
45
-
46
-
47
-
48
-
49
-
50
-
51
-
52
-
53
-
54
-
55
-
56
-
57
-
58
-
59
-
60
-
61
-
62
-
63
-
64
-
65
-
66
-
67
-
68
-
69
-
70
-
71
-
72
-
73
-
74
-
75
-
76
-
77
-
78
-
79
-
80
-
81
-
82
-
83
-
84
-
85
-
86
-
87
-
88
-
89
-
90
-
91
-
92
-
93
-
94
-
95
-
96
-
97
-
98
-
99
-
100
-
101
-
 102
102 -
 103
103 -
 104
104 -
 105
105 -
 106
106 -
 107
107 -
 108
108 -
 109
109 -
 110
110 -
 111
111 -
 112
112 -
 113
113 -
 114
114 -
 115
115 -
 116
116 -
 117
117 -
 118
118 -
 119
119 -
 120
120 -
 121
121 -
 122
122 -
123
-
124
-
125
-
126
-
127
-
128
-
129
-
130
-
131
-
132
-
133
-
134
-
135
-
136
-
137
-
138
-
139
-
140
-
141
-
142
-
143
-
144
-
145
-
146
-
147
-
148
-
149
-
150
-
151
-
152
-
153
-
154
-
155
-
156
-
157
-
158
-
159
-
160
-
161
-
162
-
163
-
164
-
165
-
166
-
167
-
168
-
169
-
170
-
171
-
172
-
173
-
174
-
175
-
176
-
177
-
178
-
179
-
180
-
181
-
182
-
183
-
184
-
185
-
186
-
187
-
188
-
189
-
190
-
191
-
192
-
193
-
194
-
195
-
196
-
197
-
198
-
199
-
200
-
201
-
202
-
203
-
204
-
205
-
206
-
207
-
208
-
209
-
210
-
211
-
212
-
213
-
214
-
215
-
216
-
217
-
218
-
219
-
220
-
221
-
222
-
223
-
224
-
225
-
226
-
227
-
228
-
229
-
230
-
231
-
232
 |
 |

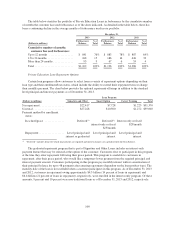
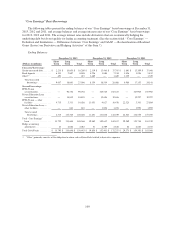
Secured borrowings comprised 81 percent of our “Core Earnings” basis debt outstanding at December 31,
2013 versus 84 percent at December 31, 2012.
Years Ended December 31,
2013 2012 2011
(Dollars in millions)
Average
Balance
Average
Rate
Average
Balance
Average
Rate
Average
Balance
Average
Rate
Unsecured borrowings:
Senior unsecured debt ............... $ 17,893 3.27% $ 18,183 2.98% $ 19,562 2.34%
Bank deposits ...................... 7,709 1.14 5,753 1.43 5,344 1.96
Other(1) ........................... 1,037 .15 1,474 .21 1,187 .17
Total unsecured borrowings ......... 26,639 2.53 25,410 2.47 26,093 2.16
Secured borrowings:
FFELP Loan securitizations ........... 95,486 .99 106,493 1.08 110,474 .93
Private Education Loan securitizations . . 19,770 2.03 19,322 2.10 20,976 2.17
FFELP Loan — other facilities ........ 12,890 .98 23,123 .97 29,749 .92
Private Education Loan — other
facilities ........................ 627 1.50 1,880 1.77 272 2.08
Total secured borrowings ........... 128,773 1.15 150,818 1.20 161,471 1.09
Total ............................. $ 155,412 1.39% $ 176,228 1.39% $ 187,564 1.24%
“Core Earnings” average balance and
rate ............................ $ 155,412 1.39% $ 176,228 1.39% $ 187,564 1.24%
Adjustment for GAAP accounting
treatment ........................ — .03 — .06 — .04
GAAP-basis average balance and rate . . . $ 155,412 1.42% $ 176,228 1.45% $ 187,564 1.28%
(1) “Other” primarily consists of the obligation to return cash collateral held related to derivative exposure.
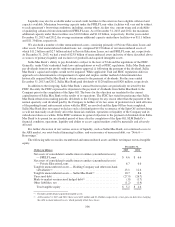
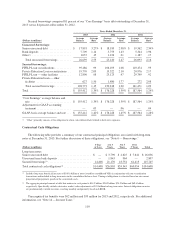
Contractual Cash Obligations
The following table provides a summary of our contractual principal obligations associated with long-term
notes at December 31, 2013. For further discussion of these obligations, see “Note 6 — Borrowings.”
(Dollars in millions)
1 Year
or Less
1to3
Years
3to5
Years
Over
5 Years Total
Long-term notes:
Senior unsecured debt ............................. $ — $ 3,790 $ 4,625 $ 7,641 $ 16,056
Unsecured term bank deposits ....................... — 1,843 964 — 2,807
Secured borrowings(1) .............................. 14,408 21,170 18,754 61,413 115,745
Total contractual cash obligations(2) ................... $14,408 $26,803 $24,343 $69,054 $134,608
(1) Includes long-term beneficial interests of $109.6 billion of notes issued by consolidated VIEs in conjunction with our securitization
transactions and included in long-term notes in the consolidated balance sheet. Timing of obligations is estimated based on our current
projection of prepayment speeds of the securitized assets.
(2) The aggregate principal amount of debt that matures in each period is $14.5 billion, $26.9 billion, $24.5 billion and $69.6 billion,
respectively. Specifically excludes derivative market value adjustments of $2.0 billion for long-term notes. Interest obligations on notes
are predominantly variable in nature, resetting monthly and quarterly based on LIBOR.
Unrecognized tax benefits were $62 million and $33 million for 2013 and 2012, respectively. For additional
information, see “Note 14 — Income Taxes.”
110