Sallie Mae 2013 Annual Report Download - page 210
Download and view the complete annual report
Please find page 210 of the 2013 Sallie Mae annual report below. You can navigate through the pages in the report by either clicking on the pages listed below, or by using the keyword search tool below to find specific information within the annual report.-
 1
1 -
2
-
3
-
4
-
5
-
6
-
7
-
8
-
9
-
10
-
11
-
12
-
13
-
14
-
15
-
16
-
17
-
18
-
19
-
20
-
21
-
22
-
23
-
24
-
25
-
26
-
27
-
28
-
29
-
30
-
31
-
32
-
33
-
34
-
35
-
36
-
37
-
38
-
39
-
40
-
41
-
42
-
43
-
44
-
45
-
46
-
47
-
48
-
49
-
50
-
51
-
52
-
53
-
54
-
55
-
56
-
57
-
58
-
59
-
60
-
61
-
62
-
63
-
64
-
65
-
66
-
67
-
68
-
69
-
70
-
71
-
72
-
73
-
74
-
75
-
76
-
77
-
78
-
79
-
80
-
81
-
82
-
83
-
84
-
85
-
86
-
87
-
88
-
89
-
90
-
91
-
92
-
93
-
94
-
95
-
96
-
97
-
98
-
99
-
100
-
101
-
102
-
103
-
104
-
105
-
106
-
107
-
108
-
109
-
110
-
111
-
112
-
113
-
114
-
115
-
116
-
117
-
118
-
119
-
120
-
121
-
122
-
123
-
124
-
125
-
126
-
127
-
128
-
129
-
130
-
131
-
132
-
133
-
134
-
135
-
136
-
137
-
138
-
139
-
140
-
141
-
142
-
143
-
144
-
145
-
146
-
147
-
148
-
149
-
150
-
151
-
152
-
153
-
154
-
155
-
156
-
157
-
158
-
159
-
160
-
161
-
162
-
163
-
164
-
165
-
166
-
167
-
168
-
169
-
170
-
171
-
172
-
173
-
174
-
175
-
176
-
177
-
178
-
179
-
180
-
181
-
182
-
183
-
184
-
185
-
186
-
187
-
188
-
189
-
190
-
191
-
192
-
193
-
194
-
195
-
196
-
197
-
198
-
199
-
 200
200 -
 201
201 -
 202
202 -
 203
203 -
 204
204 -
 205
205 -
 206
206 -
 207
207 -
 208
208 -
 209
209 -
 210
210 -
 211
211 -
 212
212 -
 213
213 -
 214
214 -
 215
215 -
 216
216 -
 217
217 -
 218
218 -
 219
219 -
 220
220 -
221
-
222
-
223
-
224
-
225
-
226
-
227
-
228
-
229
-
230
-
231
-
232
 |
 |

SLM CORPORATION
NOTES TO CONSOLIDATED FINANCIAL STATEMENTS (Continued)
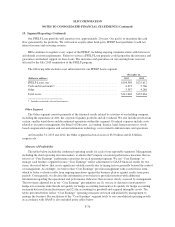
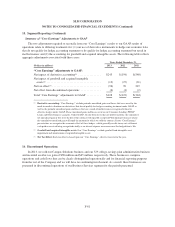
14. Income Taxes (Continued)
Accounting for Uncertainty in Income Taxes
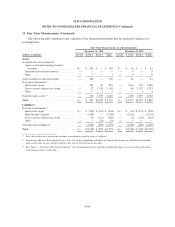
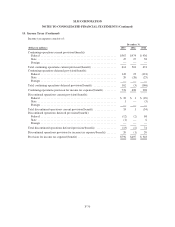
The following table summarizes changes in unrecognized tax benefits:
December 31,
(Dollars in millions) 2013 2012 2011
Unrecognized tax benefits at beginning of year $41.2 $ 45.9 $41.7
Increases resulting from tax positions taken during a prior period ....... 5.8 20.0 20.5
Decreases resulting from tax positions taken during a prior period ....... (7.7) (18.0) (2.1)
Increases/(decreases) resulting from tax positions taken during the current
period .................................................... 28.1 11.3 (9.1)
Decreases related to settlements with taxing authorities ............... (7.7) (14.7) —
Increases related to settlements with taxing authorities ................ — — 0.4
Reductions related to the lapse of statute of limitations ................ (3.7) (3.3) (5.5)
Unrecognized tax benefits at end of year ......................... $56.0 $ 41.2 $45.9
As of December 31, 2013, the gross unrecognized tax benefits are $56.0 million. Included in the
$56.0 million are $28.1 million of unrecognized tax benefits that, if recognized, would favorably impact the
effective tax rate.
The Company or one of its subsidiaries files income tax returns at the U.S. federal level, in most U.S. states,
and various foreign jurisdictions. U.S. federal income tax returns filed for years 2010 and prior have either been
audited or surveyed and are now resolved. Various combinations of subsidiaries, tax years, and jurisdictions
remain open for review, subject to statute of limitations periods (typically 3 to 4 prior years). We do not expect
the resolution of open audits to have a material impact on our unrecognized tax benefits.
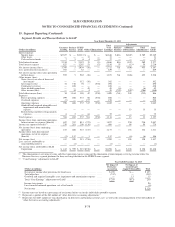
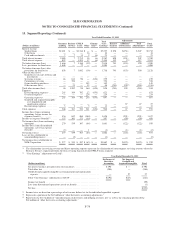
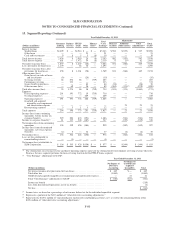
15. Segment Reporting
We monitor and assess our ongoing operations and results by three primary operating segments — the
Consumer Lending operating segment, the Business Services operating segment and the FFELP Loans operating
segment. These three operating segments meet the quantitative thresholds for reportable segments. Accordingly,
the results of operations of our Consumer Lending, Business Services and FFELP Loans segments are presented
separately. We have smaller operating segments that consist of business operations that have either been
discontinued or are winding down. These operating segments do not meet the quantitative thresholds to be
considered reportable segments. As a result, the results of operations for these operating segments (Purchased
Paper business and mortgage and other loan business) are combined with gains/losses from the repurchase of
debt, the financial results of our corporate liquidity portfolio and all overhead within the Other reportable
segment. The management reporting process measures the performance of our operating segments based on our
management structure, as well as the methodology we used to evaluate performance and allocate resources.
Management, including our chief operating decision makers, evaluates the performance of our operating
segments based on their profitability. As discussed further below, we measure the profitability of our operating
segments based on “Core Earnings.” Accordingly, information regarding our reportable segments is provided
based on a “Core Earnings” basis.
Consumer Lending Segment
In this segment, we originate, acquire, finance and service Private Education Loans. The Private Education
Loans we make are primarily to bridge the gap between the cost of higher education and the amount funded
F-72