Sallie Mae 2013 Annual Report Download - page 144
Download and view the complete annual report
Please find page 144 of the 2013 Sallie Mae annual report below. You can navigate through the pages in the report by either clicking on the pages listed below, or by using the keyword search tool below to find specific information within the annual report.-
 1
1 -
2
-
3
-
4
-
5
-
6
-
7
-
8
-
9
-
10
-
11
-
12
-
13
-
14
-
15
-
16
-
17
-
18
-
19
-
20
-
21
-
22
-
23
-
24
-
25
-
26
-
27
-
28
-
29
-
30
-
31
-
32
-
33
-
34
-
35
-
36
-
37
-
38
-
39
-
40
-
41
-
42
-
43
-
44
-
45
-
46
-
47
-
48
-
49
-
50
-
51
-
52
-
53
-
54
-
55
-
56
-
57
-
58
-
59
-
60
-
61
-
62
-
63
-
64
-
65
-
66
-
67
-
68
-
69
-
70
-
71
-
72
-
73
-
74
-
75
-
76
-
77
-
78
-
79
-
80
-
81
-
82
-
83
-
84
-
85
-
86
-
87
-
88
-
89
-
90
-
91
-
92
-
93
-
94
-
95
-
96
-
97
-
98
-
99
-
100
-
101
-
102
-
103
-
104
-
105
-
106
-
107
-
108
-
109
-
110
-
111
-
112
-
113
-
114
-
115
-
116
-
117
-
118
-
119
-
120
-
121
-
122
-
123
-
124
-
125
-
126
-
127
-
128
-
129
-
130
-
131
-
132
-
133
-
 134
134 -
 135
135 -
 136
136 -
 137
137 -
 138
138 -
 139
139 -
 140
140 -
 141
141 -
 142
142 -
 143
143 -
 144
144 -
 145
145 -
 146
146 -
 147
147 -
 148
148 -
 149
149 -
 150
150 -
 151
151 -
 152
152 -
 153
153 -
 154
154 -
155
-
156
-
157
-
158
-
159
-
160
-
161
-
162
-
163
-
164
-
165
-
166
-
167
-
168
-
169
-
170
-
171
-
172
-
173
-
174
-
175
-
176
-
177
-
178
-
179
-
180
-
181
-
182
-
183
-
184
-
185
-
186
-
187
-
188
-
189
-
190
-
191
-
192
-
193
-
194
-
195
-
196
-
197
-
198
-
199
-
200
-
201
-
202
-
203
-
204
-
205
-
206
-
207
-
208
-
209
-
210
-
211
-
212
-
213
-
214
-
215
-
216
-
217
-
218
-
219
-
220
-
221
-
222
-
223
-
224
-
225
-
226
-
227
-
228
-
229
-
230
-
231
-
232
 |
 |

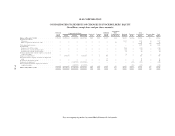
SLM CORPORATION
CONSOLIDATED STATEMENTS OF INCOME
(In millions, except per share amounts)
Years Ended December 31,
2013 2012 2011
Interest income:
FFELP Loans ................................................................. $2,822 $3,251 $3,461
Private Education Loans ........................................................ 2,527 2,481 2,429
Other loans .................................................................. 11 16 21
Cash and investments .......................................................... 17 21 19
Total interest income ............................................................. 5,377 5,769 5,930
Total interest expense ............................................................ 2,210 2,561 2,401
Net interest income .............................................................. 3,167 3,208 3,529
Less: provisions for loan losses ..................................................... 839 1,080 1,295
Net interest income after provisions for loan losses ..................................... 2,328 2,128 2,234
Other income (loss):
Gains (losses) on sales of loans and investments ..................................... 302 — (35)
Losses on derivative and hedging activities, net ...................................... (268) (628) (959)
Servicing revenue ............................................................. 290 279 283
Contingency revenue ........................................................... 420 356 333
Gains on debt repurchases ....................................................... 42 145 38
Other ....................................................................... 100 92 69
Total other income (loss) .......................................................... 886 244 (271)
Expenses:
Salaries and benefits ........................................................... 504 457 493
Other operating expenses ....................................................... 538 440 512
Total operating expenses ........................................................ 1,042 897 1,005
Goodwill and acquired intangible asset impairment and amortization expense .............. 13 27 21
Restructuring and other reorganization expenses ..................................... 72 11 12
Total expenses .................................................................. 1,127 935 1,038
Income from continuing operations, before income tax expense ........................... 2,087 1,437 925
Income tax expense .............................................................. 776 498 328
Net income from continuing operations .............................................. 1,311 939 597
Income (loss) from discontinued operations, net of tax expense (benefit) .................... 106 (2) 35
Net income .................................................................... 1,417 937 632
Less: net loss attributable to noncontrolling interest ..................................... (1) (2) (1)
Net income attributable to SLM Corporation .......................................... 1,418 939 633
Preferred stock dividends ......................................................... 20 20 18
Net income attributable to SLM Corporation common stock .............................. $1,398 $ 919 $ 615
Basic earnings per common share attributable to SLM Corporation:
Continuing operations ............................................................ $ 2.94 $ 1.93 $ 1.12
Discontinued operations .......................................................... .24 — .07
Total ......................................................................... $ 3.18 $ 1.93 $ 1.19
Average common shares outstanding ................................................ 440 476 517
Diluted earnings per common share attributable to SLM Corporation:
Continuing operations ............................................................ $ 2.89 $ 1.90 $ 1.11
Discontinued operations .......................................................... .23 — .07
Total ......................................................................... $ 3.12 $ 1.90 $ 1.18
Average common and common equivalent shares outstanding ............................ 449 483 523
Dividends per common share attributable to SLM Corporation ............................ $ .60 $ .50 $ .30
See accompanying notes to consolidated financial statements.
F-6