Sallie Mae 2013 Annual Report Download - page 174
Download and view the complete annual report
Please find page 174 of the 2013 Sallie Mae annual report below. You can navigate through the pages in the report by either clicking on the pages listed below, or by using the keyword search tool below to find specific information within the annual report.-
 1
1 -
2
-
3
-
4
-
5
-
6
-
7
-
8
-
9
-
10
-
11
-
12
-
13
-
14
-
15
-
16
-
17
-
18
-
19
-
20
-
21
-
22
-
23
-
24
-
25
-
26
-
27
-
28
-
29
-
30
-
31
-
32
-
33
-
34
-
35
-
36
-
37
-
38
-
39
-
40
-
41
-
42
-
43
-
44
-
45
-
46
-
47
-
48
-
49
-
50
-
51
-
52
-
53
-
54
-
55
-
56
-
57
-
58
-
59
-
60
-
61
-
62
-
63
-
64
-
65
-
66
-
67
-
68
-
69
-
70
-
71
-
72
-
73
-
74
-
75
-
76
-
77
-
78
-
79
-
80
-
81
-
82
-
83
-
84
-
85
-
86
-
87
-
88
-
89
-
90
-
91
-
92
-
93
-
94
-
95
-
96
-
97
-
98
-
99
-
100
-
101
-
102
-
103
-
104
-
105
-
106
-
107
-
108
-
109
-
110
-
111
-
112
-
113
-
114
-
115
-
116
-
117
-
118
-
119
-
120
-
121
-
122
-
123
-
124
-
125
-
126
-
127
-
128
-
129
-
130
-
131
-
132
-
133
-
134
-
135
-
136
-
137
-
138
-
139
-
140
-
141
-
142
-
143
-
144
-
145
-
146
-
147
-
148
-
149
-
150
-
151
-
152
-
153
-
154
-
155
-
156
-
157
-
158
-
159
-
160
-
161
-
162
-
163
-
 164
164 -
 165
165 -
 166
166 -
 167
167 -
 168
168 -
 169
169 -
 170
170 -
 171
171 -
 172
172 -
 173
173 -
 174
174 -
 175
175 -
 176
176 -
 177
177 -
 178
178 -
 179
179 -
 180
180 -
 181
181 -
 182
182 -
 183
183 -
 184
184 -
185
-
186
-
187
-
188
-
189
-
190
-
191
-
192
-
193
-
194
-
195
-
196
-
197
-
198
-
199
-
200
-
201
-
202
-
203
-
204
-
205
-
206
-
207
-
208
-
209
-
210
-
211
-
212
-
213
-
214
-
215
-
216
-
217
-
218
-
219
-
220
-
221
-
222
-
223
-
224
-
225
-
226
-
227
-
228
-
229
-
230
-
231
-
232
 |
 |

SLM CORPORATION
NOTES TO CONSOLIDATED FINANCIAL STATEMENTS (Continued)
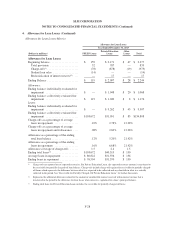
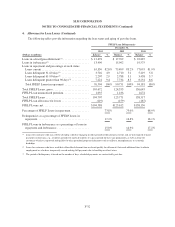
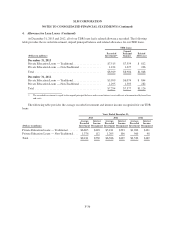
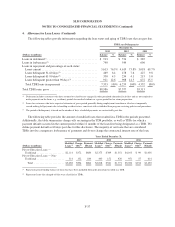
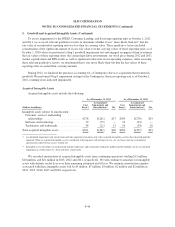
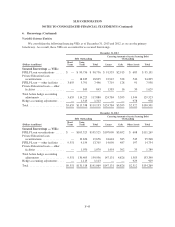
4. Allowance for Loan Losses (Continued)
At December 31, 2013 and 2012, all of our TDR loans had a related allowance recorded. The following
table provides the recorded investment, unpaid principal balance and related allowance for our TDR loans.
TDR Loans
(Dollars in millions)
Recorded
Investment(1)
Unpaid
Principal
Balance
Related
Allowance
December 31, 2013
Private Education Loans — Traditional ................... $7,515 $7,559 $ 812
Private Education Loans — Non-Traditional ............... 1,434 1,427 236
Total .............................................. $8,949 $8,986 $1,048
December 31, 2012
Private Education Loans — Traditional ................... $5,999 $6,074 $ 844
Private Education Loans — Non-Traditional ............... 1,295 1,303 282
Total .............................................. $7,294 $7,377 $1,126
(1) The recorded investment is equal to the unpaid principal balance and accrued interest receivable net of unamortized deferred fees
and costs.
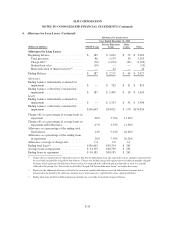
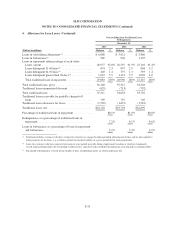
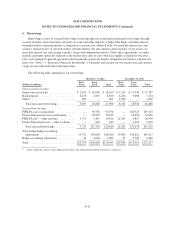
The following table provides the average recorded investment and interest income recognized for our TDR
loans.
Years Ended December 31,
2013 2012 2011
(Dollars in millions)
Average
Recorded
Investment
Interest
Income
Recognized
Average
Recorded
Investment
Interest
Income
Recognized
Average
Recorded
Investment
Interest
Income
Recognized
Private Education Loans — Traditional ....... $6,805 $418 $5,181 $333 $1,960 $121
Private Education Loans — Non-Traditional . . . 1,376 112 1,205 106 560 48
Total .................................. $8,181 $530 $6,386 $439 $2,520 $169
F-36