Sallie Mae 2013 Annual Report Download - page 64
Download and view the complete annual report
Please find page 64 of the 2013 Sallie Mae annual report below. You can navigate through the pages in the report by either clicking on the pages listed below, or by using the keyword search tool below to find specific information within the annual report.-
 1
1 -
2
-
3
-
4
-
5
-
6
-
7
-
8
-
9
-
10
-
11
-
12
-
13
-
14
-
15
-
16
-
17
-
18
-
19
-
20
-
21
-
22
-
23
-
24
-
25
-
26
-
27
-
28
-
29
-
30
-
31
-
32
-
33
-
34
-
35
-
36
-
37
-
38
-
39
-
40
-
41
-
42
-
43
-
44
-
45
-
46
-
47
-
48
-
49
-
50
-
51
-
52
-
53
-
 54
54 -
 55
55 -
 56
56 -
 57
57 -
 58
58 -
 59
59 -
 60
60 -
 61
61 -
 62
62 -
 63
63 -
 64
64 -
 65
65 -
 66
66 -
 67
67 -
 68
68 -
 69
69 -
 70
70 -
 71
71 -
 72
72 -
 73
73 -
 74
74 -
75
-
76
-
77
-
78
-
79
-
80
-
81
-
82
-
83
-
84
-
85
-
86
-
87
-
88
-
89
-
90
-
91
-
92
-
93
-
94
-
95
-
96
-
97
-
98
-
99
-
100
-
101
-
102
-
103
-
104
-
105
-
106
-
107
-
108
-
109
-
110
-
111
-
112
-
113
-
114
-
115
-
116
-
117
-
118
-
119
-
120
-
121
-
122
-
123
-
124
-
125
-
126
-
127
-
128
-
129
-
130
-
131
-
132
-
133
-
134
-
135
-
136
-
137
-
138
-
139
-
140
-
141
-
142
-
143
-
144
-
145
-
146
-
147
-
148
-
149
-
150
-
151
-
152
-
153
-
154
-
155
-
156
-
157
-
158
-
159
-
160
-
161
-
162
-
163
-
164
-
165
-
166
-
167
-
168
-
169
-
170
-
171
-
172
-
173
-
174
-
175
-
176
-
177
-
178
-
179
-
180
-
181
-
182
-
183
-
184
-
185
-
186
-
187
-
188
-
189
-
190
-
191
-
192
-
193
-
194
-
195
-
196
-
197
-
198
-
199
-
200
-
201
-
202
-
203
-
204
-
205
-
206
-
207
-
208
-
209
-
210
-
211
-
212
-
213
-
214
-
215
-
216
-
217
-
218
-
219
-
220
-
221
-
222
-
223
-
224
-
225
-
226
-
227
-
228
-
229
-
230
-
231
-
232
 |
 |
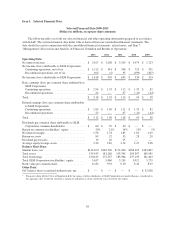
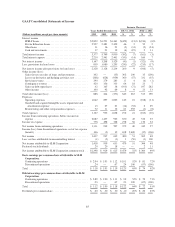
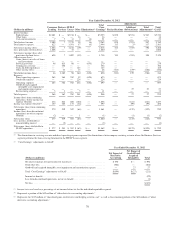
segment disclosures as required by GAAP under ASC 280 “Segment Reporting” (see “Note 15 — Segment
Reporting”). For a full explanation of the contents and limitations of “Core Earnings,” see the section titled
“‘Core Earnings’ — Definition and Limitations” of this Item 7.
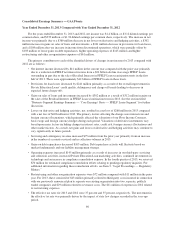
2013 Summary of Results
Our 2013 accomplishments are discussed below.
GAAP 2013 net income was $1.42 billion ($3.12 diluted earnings per share), versus net income of
$939 million ($1.90 diluted earnings per share) in the prior year. The changes in GAAP net income are driven by
the same “Core Earnings” items discussed below as well as changes in “mark-to-market” unrealized gains and
losses on derivative contracts and amortization and impairment of goodwill and intangible assets that are
recognized in GAAP but not in “Core Earnings” results. In 2013 and 2012, GAAP results included gains of $243
million and losses of $194 million, respectively, resulting from derivative accounting treatment which is
excluded from “Core Earnings” results.
“Core Earnings” for 2013 were $1.29 billion compared with $1.06 billion in 2012. “Core Earnings”
increased due to a $302 million increase in gains on sales of loans and investments, a $241 million lower
provision for loan loss, a $109 million after-tax increase in gains from the sale of subsidiaries and a $75 million
increase in servicing and contingency revenue. This was partially offset by a $106 million decrease in net interest
income, a $145 million increase in operating expenses, a $97 million decrease in debt repurchase gains and a $61
million increase in restructuring and other reorganization expenses.
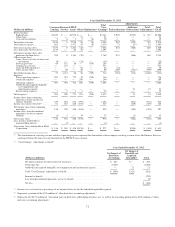
During 2013, we issued $3.75 billion of unsecured debt, and issued $6.5 billion of FFELP ABS and
$3.1 billion of Private Education Loan ABS. We also repurchased $1.3 billion of debt and realized “Core
Earnings” gains of $48 million in 2013, compared with repurchases of $711 million and gains of $145 million in
2012. In addition, we repurchased $600 million of common stock in 2013 compared with $900 million
repurchased in 2012.
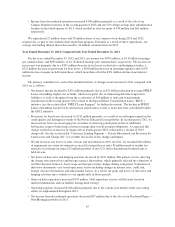
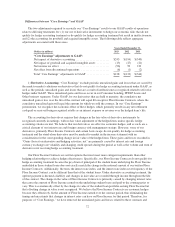
2013 Management Objectives
In 2013, we set out five major goals to create shareholder value. They were: (1) prudently grow Consumer
Lending segment assets and revenues; (2) maximize cash flows from FFELP Loans; (3) reduce operating
expenses while improving efficiency and customer experience; (4) maintain our financial strength; and
(5) expand the capabilities of Sallie Mae Bank.
The following describes our performance relative to each of our 2013 goals.
Prudently Grow Consumer Lending Segment Assets and Revenues
We continued to pursue managed growth in our Private Education Loan portfolio in 2013, with $3.8 billion
in new originations for the year compared with $3.3 billion in 2012, a 14 percent increase. The average FICO
score of our 2013 originations was 745 and approximately 90 percent of the originated loans were cosigned. We
continued to help our customers manage their borrowings and succeed in its payoff, which resulted in lower
charge-offs and provision for loan losses. The charge-off rate was 2.8 percent in 2013, the lowest rate since 2007,
and down from 3.4 percent in 2012, an 18 percent decrease. The provision for Private Education Loan losses
decreased $221 million from 2012, a 22 percent decrease.
Maximize Cash Flows from FFELP Loans
In 2013, management set out to explore alternative transactions and structures that could increase our ability
to maximize the value of our ownership interests in FFELP securitization trusts and allow us to diversify our
holdings while maintaining servicing fee income. In 2013, we sold our ownership interest in five of our FFELP
Loan securitization trusts ($12.5 billion of securitization trust assets and $12.1 billion of related liabilities) which
generated a $312 million gain on sale. During 2013 we also purchased $736 million of FFELP Loans.
62