Sallie Mae 2013 Annual Report Download - page 191
Download and view the complete annual report
Please find page 191 of the 2013 Sallie Mae annual report below. You can navigate through the pages in the report by either clicking on the pages listed below, or by using the keyword search tool below to find specific information within the annual report.-
 1
1 -
2
-
3
-
4
-
5
-
6
-
7
-
8
-
9
-
10
-
11
-
12
-
13
-
14
-
15
-
16
-
17
-
18
-
19
-
20
-
21
-
22
-
23
-
24
-
25
-
26
-
27
-
28
-
29
-
30
-
31
-
32
-
33
-
34
-
35
-
36
-
37
-
38
-
39
-
40
-
41
-
42
-
43
-
44
-
45
-
46
-
47
-
48
-
49
-
50
-
51
-
52
-
53
-
54
-
55
-
56
-
57
-
58
-
59
-
60
-
61
-
62
-
63
-
64
-
65
-
66
-
67
-
68
-
69
-
70
-
71
-
72
-
73
-
74
-
75
-
76
-
77
-
78
-
79
-
80
-
81
-
82
-
83
-
84
-
85
-
86
-
87
-
88
-
89
-
90
-
91
-
92
-
93
-
94
-
95
-
96
-
97
-
98
-
99
-
100
-
101
-
102
-
103
-
104
-
105
-
106
-
107
-
108
-
109
-
110
-
111
-
112
-
113
-
114
-
115
-
116
-
117
-
118
-
119
-
120
-
121
-
122
-
123
-
124
-
125
-
126
-
127
-
128
-
129
-
130
-
131
-
132
-
133
-
134
-
135
-
136
-
137
-
138
-
139
-
140
-
141
-
142
-
143
-
144
-
145
-
146
-
147
-
148
-
149
-
150
-
151
-
152
-
153
-
154
-
155
-
156
-
157
-
158
-
159
-
160
-
161
-
162
-
163
-
164
-
165
-
166
-
167
-
168
-
169
-
170
-
171
-
172
-
173
-
174
-
175
-
176
-
177
-
178
-
179
-
180
-
 181
181 -
 182
182 -
 183
183 -
 184
184 -
 185
185 -
 186
186 -
 187
187 -
 188
188 -
 189
189 -
 190
190 -
 191
191 -
 192
192 -
 193
193 -
 194
194 -
 195
195 -
 196
196 -
 197
197 -
 198
198 -
 199
199 -
 200
200 -
 201
201 -
202
-
203
-
204
-
205
-
206
-
207
-
208
-
209
-
210
-
211
-
212
-
213
-
214
-
215
-
216
-
217
-
218
-
219
-
220
-
221
-
222
-
223
-
224
-
225
-
226
-
227
-
228
-
229
-
230
-
231
-
232
 |
 |

SLM CORPORATION
NOTES TO CONSOLIDATED FINANCIAL STATEMENTS (Continued)
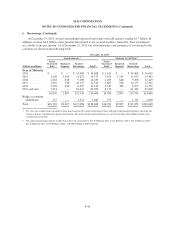
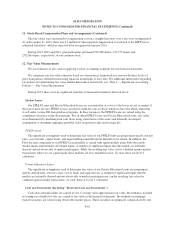
7. Derivative Financial Instruments (Continued)
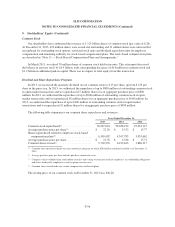
Impact of Derivatives on Consolidated Statements of Income
Years Ended December 31,
Unrealized Gain
(Loss) on
Derivatives(1)(2)
Realized Gain
(Loss) on
Derivatives(3)
Unrealized Gain
(Loss) on
Hedged Item(1) Total Gain (Loss)
(Dollars in millions) 2013 2012 2011 2013 2012 2011 2013 2012 2011 2013 2012 2011
Fair Value Hedges:
Interest rate swaps ...... $(806) $ (75) $ 503 $ 414 $ 449 $ 481 $ 873 $ 41 $(554) $ 481 $ 415 $ 430
Cross-currency interest
rate swaps ........... 1 42 (723) 98 167 314 (183) (182) 664 (84) 27 255
Total fair value
derivatives .......... (805) (33) (220) 512 616 795 690 (141) 110 397 442 685
Cash Flow Hedges:
Interest rate swaps ...... — (1) (1) (9) (26) (39) — — — (9) (27) (40)
Total cash flow
derivatives .......... — (1) (1) (9) (26) (39) — — — (9) (27) (40)
Trading:
Interest rate swaps ...... (107) (66) 183 71 108 69———(36) 42 252
Floor Income Contracts . . 785 412 (267) (815) (859) (903) — — — (30) (447) (1,170)
Cross-currency interest
rate swaps ........... (101) (59) 29 35 7 8———(66) (52) 37
Other ................ (19) 5 22 (2) (1) 11———(21) 4 33
Total trading
derivatives .......... 558 292 (33) (711) (745) (815) — — — (153) (453) (848)
Total ................. (247) 258 (254) (208) (155) (59) 690 (141) 110 235 (38) (203)
Less: realized gains
(losses) recorded in
interest expense ...... — — — 503 590 756———503590 756
Gains (losses) on
derivative and hedging
activities, net ........ $(247) $258 $(254) $(711) $(745) $(815) $ 690 $(141) $ 110 $(268) $(628) $ (959)
(1) Recorded in “Gains (losses) on derivative and hedging activities, net” in the consolidated statements of income.
(2) Represents ineffectiveness related to cash flow hedges.
(3) For fair value and cash flow hedges, recorded in interest expense. For trading derivatives, recorded in “Gains (losses) on derivative and
hedging activities, net.”
F-53