Sallie Mae 2013 Annual Report Download - page 197
Download and view the complete annual report
Please find page 197 of the 2013 Sallie Mae annual report below. You can navigate through the pages in the report by either clicking on the pages listed below, or by using the keyword search tool below to find specific information within the annual report.-
 1
1 -
2
-
3
-
4
-
5
-
6
-
7
-
8
-
9
-
10
-
11
-
12
-
13
-
14
-
15
-
16
-
17
-
18
-
19
-
20
-
21
-
22
-
23
-
24
-
25
-
26
-
27
-
28
-
29
-
30
-
31
-
32
-
33
-
34
-
35
-
36
-
37
-
38
-
39
-
40
-
41
-
42
-
43
-
44
-
45
-
46
-
47
-
48
-
49
-
50
-
51
-
52
-
53
-
54
-
55
-
56
-
57
-
58
-
59
-
60
-
61
-
62
-
63
-
64
-
65
-
66
-
67
-
68
-
69
-
70
-
71
-
72
-
73
-
74
-
75
-
76
-
77
-
78
-
79
-
80
-
81
-
82
-
83
-
84
-
85
-
86
-
87
-
88
-
89
-
90
-
91
-
92
-
93
-
94
-
95
-
96
-
97
-
98
-
99
-
100
-
101
-
102
-
103
-
104
-
105
-
106
-
107
-
108
-
109
-
110
-
111
-
112
-
113
-
114
-
115
-
116
-
117
-
118
-
119
-
120
-
121
-
122
-
123
-
124
-
125
-
126
-
127
-
128
-
129
-
130
-
131
-
132
-
133
-
134
-
135
-
136
-
137
-
138
-
139
-
140
-
141
-
142
-
143
-
144
-
145
-
146
-
147
-
148
-
149
-
150
-
151
-
152
-
153
-
154
-
155
-
156
-
157
-
158
-
159
-
160
-
161
-
162
-
163
-
164
-
165
-
166
-
167
-
168
-
169
-
170
-
171
-
172
-
173
-
174
-
175
-
176
-
177
-
178
-
179
-
180
-
181
-
182
-
183
-
184
-
185
-
186
-
 187
187 -
 188
188 -
 189
189 -
 190
190 -
 191
191 -
 192
192 -
 193
193 -
 194
194 -
 195
195 -
 196
196 -
 197
197 -
 198
198 -
 199
199 -
 200
200 -
 201
201 -
 202
202 -
 203
203 -
 204
204 -
 205
205 -
 206
206 -
 207
207 -
208
-
209
-
210
-
211
-
212
-
213
-
214
-
215
-
216
-
217
-
218
-
219
-
220
-
221
-
222
-
223
-
224
-
225
-
226
-
227
-
228
-
229
-
230
-
231
-
232
 |
 |

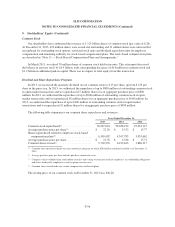
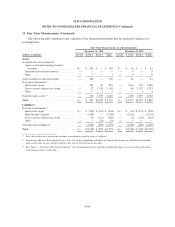
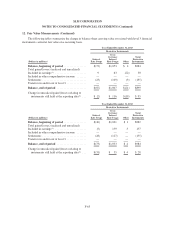
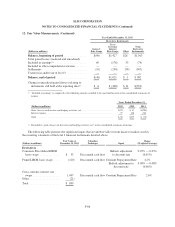
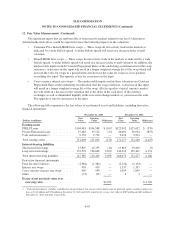
SLM CORPORATION
NOTES TO CONSOLIDATED FINANCIAL STATEMENTS (Continued)
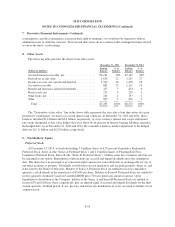
11. Stock-Based Compensation Plans and Arrangements (Continued)
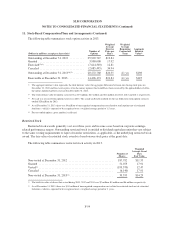
The following table summarizes stock option activity in 2013.
(Dollars in millions, except per share data)
Number of
Options
Weighted
Average
Exercise
Price per
Share
Weighted
Average
Remaining
Contractual
Term
Aggregate
Intrinsic
Value(1)
Outstanding at December 31, 2012 .......... 25,992,747 $19.84
Granted ................................ 3,980,008 17.92
Exercised(2)(3) ........................... (7,614,500) 12.81
Canceled ............................... (2,085,495) 34.94
Outstanding at December 31, 2013(4)(5) ....... 20,272,760 $20.55 4.1 yrs $198
Exercisable at December 31, 2013 ........... 14,426,174 $21.84 4.1 yrs $145
(1) The aggregate intrinsic value represents the total intrinsic value (the aggregate difference between our closing stock price on
December 31, 2013 and the exercise price of in-the-money options) that would have been received by the option holders if all in-
the-money options had been exercised on December 31, 2013.
(2) The total intrinsic value of options exercised was $73 million, $27 million and $14 million for 2013, 2012 and 2011, respectively.
(3) No cash was received from option exercises in 2013. The actual tax benefit realized for the tax deductions from option exercises
totaled $28 million for 2013.
(4) As of December 31, 2013, there was $4 million of unrecognized compensation cost related to stock options net of estimated
forfeitures, which is expected to be recognized over a weighted average period of 1.5 years.
(5) For net-settled options, gross number is reflected.
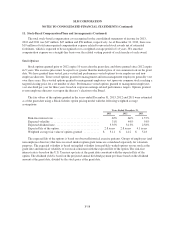
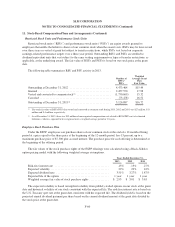
Restricted Stock
Restricted stock awards generally vest over three years and in some cases based on corporate earnings-
related performance targets. Outstanding restricted stock is entitled to dividend equivalent units that vest subject
to the same vesting requirements or lapse of transfer restrictions, as applicable, as the underlying restricted stock
award. The fair value of restricted stock awards is based on our stock price at the grant date.
The following table summarizes restricted stock activity in 2013.
Number of
Shares
Weighted
Average Grant
Date
Fair Value
Non-vested at December 31, 2012 ............................... 187,792 $11.55
Granted .................................................... 51,073 17.91
Vested(1) .................................................... (193,370) 12.47
Canceled ................................................... (6,140) 17.91
Non-vested at December 31, 2013(2) .............................. 39,355 $14.29
(1) The total fair value of shares that vested during 2013, 2012 and 2011 was $2 million, $4 million and $6 million, respectively.
(2) As of December 31, 2013, there was $.01 million of unrecognized compensation cost related to restricted stock net of estimated
forfeitures, which is expected to be recognized over a weighted average period of .1 years.
F-59