Sallie Mae 2013 Annual Report Download - page 42
Download and view the complete annual report
Please find page 42 of the 2013 Sallie Mae annual report below. You can navigate through the pages in the report by either clicking on the pages listed below, or by using the keyword search tool below to find specific information within the annual report.-
 1
1 -
2
-
3
-
4
-
5
-
6
-
7
-
8
-
9
-
10
-
11
-
12
-
13
-
14
-
15
-
16
-
17
-
18
-
19
-
20
-
21
-
22
-
23
-
24
-
25
-
26
-
27
-
28
-
29
-
30
-
31
-
 32
32 -
 33
33 -
 34
34 -
 35
35 -
 36
36 -
 37
37 -
 38
38 -
 39
39 -
 40
40 -
 41
41 -
 42
42 -
 43
43 -
 44
44 -
 45
45 -
 46
46 -
 47
47 -
 48
48 -
 49
49 -
 50
50 -
 51
51 -
 52
52 -
53
-
54
-
55
-
56
-
57
-
58
-
59
-
60
-
61
-
62
-
63
-
64
-
65
-
66
-
67
-
68
-
69
-
70
-
71
-
72
-
73
-
74
-
75
-
76
-
77
-
78
-
79
-
80
-
81
-
82
-
83
-
84
-
85
-
86
-
87
-
88
-
89
-
90
-
91
-
92
-
93
-
94
-
95
-
96
-
97
-
98
-
99
-
100
-
101
-
102
-
103
-
104
-
105
-
106
-
107
-
108
-
109
-
110
-
111
-
112
-
113
-
114
-
115
-
116
-
117
-
118
-
119
-
120
-
121
-
122
-
123
-
124
-
125
-
126
-
127
-
128
-
129
-
130
-
131
-
132
-
133
-
134
-
135
-
136
-
137
-
138
-
139
-
140
-
141
-
142
-
143
-
144
-
145
-
146
-
147
-
148
-
149
-
150
-
151
-
152
-
153
-
154
-
155
-
156
-
157
-
158
-
159
-
160
-
161
-
162
-
163
-
164
-
165
-
166
-
167
-
168
-
169
-
170
-
171
-
172
-
173
-
174
-
175
-
176
-
177
-
178
-
179
-
180
-
181
-
182
-
183
-
184
-
185
-
186
-
187
-
188
-
189
-
190
-
191
-
192
-
193
-
194
-
195
-
196
-
197
-
198
-
199
-
200
-
201
-
202
-
203
-
204
-
205
-
206
-
207
-
208
-
209
-
210
-
211
-
212
-
213
-
214
-
215
-
216
-
217
-
218
-
219
-
220
-
221
-
222
-
223
-
224
-
225
-
226
-
227
-
228
-
229
-
230
-
231
-
232
 |
 |
Higher than expected prepayments of loans could reduce servicing revenues or reduce or delay payments we
receive as the holder of the Residual Interests of securitization trusts holding education loans.
FFELP Loans and Private Education loans may be voluntarily prepaid without penalty by borrowers or, in
the case of FFELP Loans, consolidated with the borrowers’ other education loans through refinancing into the
federal DSLP. FFELP Loans may also be repaid after default by the Guarantors of FFELP Loans. Prepayment
rates and levels are subject to many factors which are beyond our control, including repayment through loan
consolidation programs. When education loans contained within a securitization trust are prepaid, the fees we
earn as servicer decrease and the value of any Residual Interest we own in the securitization trust may decline.
While some fluctuation in prepayment levels is to be expected, extraordinary or extended increases in
prepayment levels could materially adversely affect our liquidity, income and the value of those Residual
Interests.
Our credit ratings are important to our liquidity. A reduction in our credit ratings could adversely affect our
liquidity, increase our borrowing costs and limit our access to the capital markets.
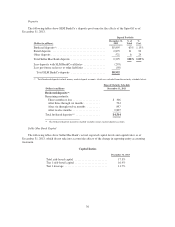
We have unsecured debt that totaled, as of December 31, 2013, approximately $18.3 billion. In connection
with our May 28, 2013 announcement of the proposed Spin-Off, three rating agencies took negative ratings
actions with regard to our long-term unsecured debt ratings. Fitch Ratings, Inc. (“Fitch”) lowered its senior
unsecured long-term debt rating one notch to BB+, one notch below its investment grade, and also placed its
rating on negative watch. Moody’s Investors Services, Inc. (“Moody’s”) and Standard & Poor’s Ratings Services
LLC (“S&P”) placed their ratings on our senior unsecured long-term debt on review and watch, respectively, for
possible downgrade. Moody’s current rating is Ba1, one notch below its investment grade, and S&P’s rating is
BBB-, its lowest investment grade. Fitch and S&P indicated that if the Spin-Off occurs as planned, they expect to
further lower their ratings by one notch and up to two notches, respectively. As a result of Fitch’s action, two of
the three credit rating agencies now rate our long term unsecured debt at below investment grade such that we are
no longer considered an investment grade issuer. Whereas we had previously been included in the Investment
Grade Index, we are now included in the High Yield Index. This has resulted in a higher cost of funds for us, and
our senior unsecured debt to trade with greater volatility.
The negative actions taken by the credit rating agencies were based on concerns that the Spin-Off will have
a negative impact on the holders of our senior unsecured debt. According to their ratings reports, these concerns
primarily focus on NewCo’s lack of future Private Student Loan originations and related servicing income, the
loss of access to the earnings, cash flow, equity and potential market value of Sallie Mae Bank, the run-off of the
FFELP Loan portfolio and strategic uncertainty as to the source of incremental earnings and cash flow to replace
that in run-off, and an expected increase in our cost of accessing the unsecured debt markets, including for
refinancing purposes.
We utilize the unsecured debt markets to help fund our business. The amount, type and cost of our funding
directly affects the cost of operating our business and growing our assets and is dependent upon outside factors,
including our credit ratings from ratings agencies. There can be no assurance that our credit ratings will not be
changed in the future. A reduction in the credit ratings of our senior unsecured debt could adversely affect our
liquidity, increase our borrowing costs or limit our access to the capital markets. We may also face additional
challenges in the future, including more limited capital resources to invest in or expand our businesses.
Our use of derivatives to manage interest rate sensitivity exposes us to credit and market risk that could have a
material adverse effect on our earnings.
We maintain an overall interest rate strategy that uses derivatives to minimize the economic effect of
interest rate changes. Developing an effective strategy for dealing with movements in interest rates is complex,
and no strategy can completely avoid the risks associated with these fluctuations. For example, our student loan
portfolio remains subject to prepayment risk that could result in its being under- or over-hedged, which could
result in material losses. In addition, our interest rate risk management activities expose us to mark-to-market
losses if interest rates move in a materially different way than was expected when we entered into the related
40