Sallie Mae 2013 Annual Report Download - page 71
Download and view the complete annual report
Please find page 71 of the 2013 Sallie Mae annual report below. You can navigate through the pages in the report by either clicking on the pages listed below, or by using the keyword search tool below to find specific information within the annual report.-
 1
1 -
2
-
3
-
4
-
5
-
6
-
7
-
8
-
9
-
10
-
11
-
12
-
13
-
14
-
15
-
16
-
17
-
18
-
19
-
20
-
21
-
22
-
23
-
24
-
25
-
26
-
27
-
28
-
29
-
30
-
31
-
32
-
33
-
34
-
35
-
36
-
37
-
38
-
39
-
40
-
41
-
42
-
43
-
44
-
45
-
46
-
47
-
48
-
49
-
50
-
51
-
52
-
53
-
54
-
55
-
56
-
57
-
58
-
59
-
60
-
 61
61 -
 62
62 -
 63
63 -
 64
64 -
 65
65 -
 66
66 -
 67
67 -
 68
68 -
 69
69 -
 70
70 -
 71
71 -
 72
72 -
 73
73 -
 74
74 -
 75
75 -
 76
76 -
 77
77 -
 78
78 -
 79
79 -
 80
80 -
 81
81 -
82
-
83
-
84
-
85
-
86
-
87
-
88
-
89
-
90
-
91
-
92
-
93
-
94
-
95
-
96
-
97
-
98
-
99
-
100
-
101
-
102
-
103
-
104
-
105
-
106
-
107
-
108
-
109
-
110
-
111
-
112
-
113
-
114
-
115
-
116
-
117
-
118
-
119
-
120
-
121
-
122
-
123
-
124
-
125
-
126
-
127
-
128
-
129
-
130
-
131
-
132
-
133
-
134
-
135
-
136
-
137
-
138
-
139
-
140
-
141
-
142
-
143
-
144
-
145
-
146
-
147
-
148
-
149
-
150
-
151
-
152
-
153
-
154
-
155
-
156
-
157
-
158
-
159
-
160
-
161
-
162
-
163
-
164
-
165
-
166
-
167
-
168
-
169
-
170
-
171
-
172
-
173
-
174
-
175
-
176
-
177
-
178
-
179
-
180
-
181
-
182
-
183
-
184
-
185
-
186
-
187
-
188
-
189
-
190
-
191
-
192
-
193
-
194
-
195
-
196
-
197
-
198
-
199
-
200
-
201
-
202
-
203
-
204
-
205
-
206
-
207
-
208
-
209
-
210
-
211
-
212
-
213
-
214
-
215
-
216
-
217
-
218
-
219
-
220
-
221
-
222
-
223
-
224
-
225
-
226
-
227
-
228
-
229
-
230
-
231
-
232
 |
 |

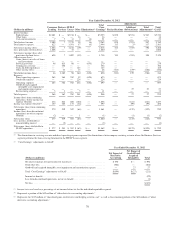
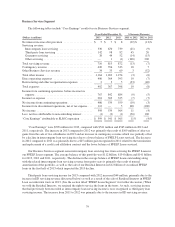
Year Ended December 31, 2013
(Dollars in millions)
Consumer
Lending
Business
Services
FFELP
Loans Other Eliminations(1)
Total
“Core
Earnings”
Adjustments
Total
GAAPReclassifications
Additions/
(Subtractions)
Total
Adjustments(2)
Interest income:
Student loans ............... $2,527 $ — $2,313 $ — $ — $4,840 $ 816 $(307) $ 509 $5,349
Other loans ................. — — — 11 — 11 — — — 11
Cash and investments ......... 7 5 6 4 (5) 17 — — — 17
Total interest income ........... 2,534 5 2,319 15 (5) 4,868 816 (307) 509 5,377
Total interest expense ........... 825 — 1,285 51 (5) 2,156 55 (1)(4) 54 2,210
Net interest income (loss) ........ 1,709 5 1,034 (36) — 2,712 761 (306) 455 3,167
Less: provisions for loan losses . . . 787 — 52 — — 839 — — — 839
Net interest income (loss) after
provisions for loan losses ...... 922 5 982 (36) — 1,873 761 (306) 455 2,328
Other income (loss):
Gains (losses) on sales of loans
and investments ........... — — 312 (10) — 302 — — — 302
Servicing revenue ............ 34 710 76 — (530) 290 — — — 290
Contingency revenue ......... — 420 — — — 420 — — — 420
Gains on debt repurchases ..... — — — 48 — 48 (6) — (6) 42
Other income (loss) .......... — 34 — 4 — 38 (755) 549(5) (206) (168)
Total other income (loss) ........ 34 1,164 388 42 (530) 1,098 (761) 549 (212) 886
Expenses:
Direct operating expenses ..... 299 400 557 80 (530) 806 — — — 806
Overhead expenses ........... (1) — — 237 — 236 — — — 236
Operating expenses .......... 298 400 557 317 (530) 1,042 — — — 1,042
Goodwill and acquired
intangible asset impairment
and amortization expense .... — — — — — — — 13 13 13
Restructuring and other
reorganization expenses ..... 6 2 — 64 — 72 — — — 72
Total expenses ................ 304 402 557 381 (530) 1,114 — 13 13 1,127
Income (loss) from continuing
operations, before income tax
expense (benefit) ............ 652 767 813 (375) — 1,857 — 230 230 2,087
Income tax expense (benefit)(3) . . . 239 281 298 (138) — 680 — 96 96 776
Net income (loss) from continuing
operations .................. 413 486 515 (237) — 1,177 — 134 134 1,311
Income (loss) from discontinued
operations, net of tax expense
(benefit) ................... (1) 112 — 1 — 112 — (6) (6) 106
Net income (loss) .............. 412 598 515 (236) — 1,289 — 128 128 1,417
Less: net loss attributable to
noncontrolling interest ........ — (1) — — — (1) — — — (1)
Net income (loss) attributable to
SLM Corporation ............ $ 412 $ 599 $ 515 $(236) $ — $1,290 $ — $ 128 $ 128 $1,418
(1) The eliminations in servicing revenue and direct operating expense represent the elimination of intercompany servicing revenue where the Business Services
segment performs the loan servicing function for the FFELP Loans segment.
(2) “Core Earnings” adjustments to GAAP:
Year Ended December 31, 2013
(Dollars in millions)
Net Impact of
Derivative
Accounting
Net Impact of
Goodwill and
Acquired
Intangibles Total
Net interest income after provisions for loan losses ............................ $455 $— $455
Total other loss ........................................................ (212) — (212)
Goodwill and acquired intangible asset impairment and amortization expense ....... — 13 13
Total “Core Earnings” adjustments to GAAP ................................. $243 $(13) 230
Income tax expense ..................................................... 96
Loss from discontinued operations, net of tax benefit ........................... (6)
Net income ............................................................ $128
(3) Income taxes are based on a percentage of net income before tax for the individual reportable segment.
(4) Represents a portion of the $63 million of “other derivative accounting adjustments.”
(5) Represents the $487 million of “unrealized gains on derivative and hedging activities, net” as well as the remaining portion of the $63 million of “other
derivative accounting adjustments.”
69