Sallie Mae 2013 Annual Report Download - page 169
Download and view the complete annual report
Please find page 169 of the 2013 Sallie Mae annual report below. You can navigate through the pages in the report by either clicking on the pages listed below, or by using the keyword search tool below to find specific information within the annual report.-
 1
1 -
2
-
3
-
4
-
5
-
6
-
7
-
8
-
9
-
10
-
11
-
12
-
13
-
14
-
15
-
16
-
17
-
18
-
19
-
20
-
21
-
22
-
23
-
24
-
25
-
26
-
27
-
28
-
29
-
30
-
31
-
32
-
33
-
34
-
35
-
36
-
37
-
38
-
39
-
40
-
41
-
42
-
43
-
44
-
45
-
46
-
47
-
48
-
49
-
50
-
51
-
52
-
53
-
54
-
55
-
56
-
57
-
58
-
59
-
60
-
61
-
62
-
63
-
64
-
65
-
66
-
67
-
68
-
69
-
70
-
71
-
72
-
73
-
74
-
75
-
76
-
77
-
78
-
79
-
80
-
81
-
82
-
83
-
84
-
85
-
86
-
87
-
88
-
89
-
90
-
91
-
92
-
93
-
94
-
95
-
96
-
97
-
98
-
99
-
100
-
101
-
102
-
103
-
104
-
105
-
106
-
107
-
108
-
109
-
110
-
111
-
112
-
113
-
114
-
115
-
116
-
117
-
118
-
119
-
120
-
121
-
122
-
123
-
124
-
125
-
126
-
127
-
128
-
129
-
130
-
131
-
132
-
133
-
134
-
135
-
136
-
137
-
138
-
139
-
140
-
141
-
142
-
143
-
144
-
145
-
146
-
147
-
148
-
149
-
150
-
151
-
152
-
153
-
154
-
155
-
156
-
157
-
158
-
 159
159 -
 160
160 -
 161
161 -
 162
162 -
 163
163 -
 164
164 -
 165
165 -
 166
166 -
 167
167 -
 168
168 -
 169
169 -
 170
170 -
 171
171 -
 172
172 -
 173
173 -
 174
174 -
 175
175 -
 176
176 -
 177
177 -
 178
178 -
 179
179 -
180
-
181
-
182
-
183
-
184
-
185
-
186
-
187
-
188
-
189
-
190
-
191
-
192
-
193
-
194
-
195
-
196
-
197
-
198
-
199
-
200
-
201
-
202
-
203
-
204
-
205
-
206
-
207
-
208
-
209
-
210
-
211
-
212
-
213
-
214
-
215
-
216
-
217
-
218
-
219
-
220
-
221
-
222
-
223
-
224
-
225
-
226
-
227
-
228
-
229
-
230
-
231
-
232
 |
 |

SLM CORPORATION
NOTES TO CONSOLIDATED FINANCIAL STATEMENTS (Continued)
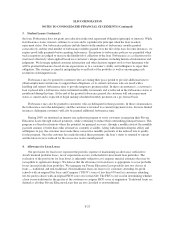
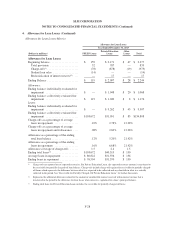
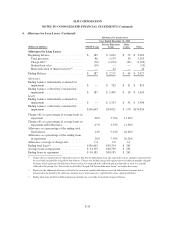
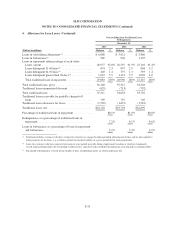
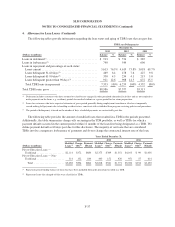
4. Allowance for Loan Losses (Continued)
Key Credit Quality Indicators
FFELP Loans are substantially insured and guaranteed as to their principal and accrued interest in the event
of default; therefore, the key credit quality indicator for this portfolio is loan status. The impact of changes in
loan status is incorporated quarterly into the allowance for loan losses calculation.
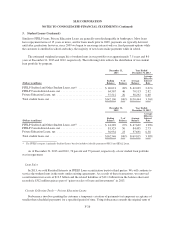
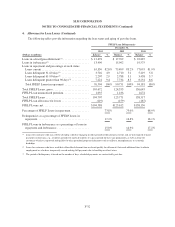
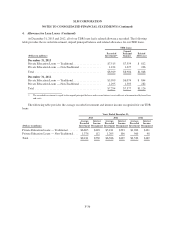
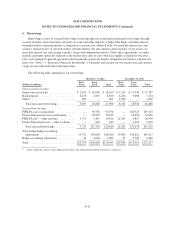
For Private Education Loans, the key credit quality indicators are school type, FICO scores, the existence of
a cosigner, the loan status and loan seasoning. The school type/FICO score are assessed at origination and
maintained through the traditional/non-traditional loan designation. The other Private Education Loan key quality
indicators can change and are incorporated quarterly into the allowance for loan losses calculation. The following
table highlights the principal balance (excluding the receivable for partially charged-off loans) of our Private
Education Loan portfolio stratified by the key credit quality indicators.
Private Education Loans
Credit Quality Indicators
December 31, 2013 December 31, 2012
(Dollars in millions) Balance(3) % of Balance Balance(3) % of Balance
Credit Quality Indicators
School Type/FICO Scores:
Traditional ........................................ $36,140 93% $35,347 92%
Non-Traditional(1) ................................... 2,860 7 3,207 8
Total ............................................... $39,000 100% $38,554 100%
Cosigners:
With cosigner ...................................... $26,321 67% $24,907 65%
Without cosigner ................................... 12,679 33 13,647 35
Total ............................................... $39,000 100% $38,554 100%
Seasoning(2):
1-12 payments ..................................... $ 5,171 14% $ 7,371 19%
13-24 payments .................................... 5,511 14 6,137 16
25-36 payments .................................... 5,506 14 6,037 16
37-48 payments .................................... 5,103 13 4,780 12
More than 48 payments .............................. 11,181 29 8,325 22
Not yet in repayment ................................ 6,528 16 5,904 15
Total ............................................... $39,000 100% $38,554 100%
(1) Defined as loans to customers attending for-profit schools (with a FICO score of less than 670 at origination) and customers attending not-
for-profit schools (with a FICO score of less than 640 at origination).
(2) Number of months in active repayment for which a scheduled payment was due.
(3) Balance represents gross Private Education Loans.
F-31