Sallie Mae 2013 Annual Report Download - page 105
Download and view the complete annual report
Please find page 105 of the 2013 Sallie Mae annual report below. You can navigate through the pages in the report by either clicking on the pages listed below, or by using the keyword search tool below to find specific information within the annual report.-
 1
1 -
2
-
3
-
4
-
5
-
6
-
7
-
8
-
9
-
10
-
11
-
12
-
13
-
14
-
15
-
16
-
17
-
18
-
19
-
20
-
21
-
22
-
23
-
24
-
25
-
26
-
27
-
28
-
29
-
30
-
31
-
32
-
33
-
34
-
35
-
36
-
37
-
38
-
39
-
40
-
41
-
42
-
43
-
44
-
45
-
46
-
47
-
48
-
49
-
50
-
51
-
52
-
53
-
54
-
55
-
56
-
57
-
58
-
59
-
60
-
61
-
62
-
63
-
64
-
65
-
66
-
67
-
68
-
69
-
70
-
71
-
72
-
73
-
74
-
75
-
76
-
77
-
78
-
79
-
80
-
81
-
82
-
83
-
84
-
85
-
86
-
87
-
88
-
89
-
90
-
91
-
92
-
93
-
94
-
 95
95 -
 96
96 -
 97
97 -
 98
98 -
 99
99 -
 100
100 -
 101
101 -
 102
102 -
 103
103 -
 104
104 -
 105
105 -
 106
106 -
 107
107 -
 108
108 -
 109
109 -
 110
110 -
 111
111 -
 112
112 -
 113
113 -
 114
114 -
 115
115 -
116
-
117
-
118
-
119
-
120
-
121
-
122
-
123
-
124
-
125
-
126
-
127
-
128
-
129
-
130
-
131
-
132
-
133
-
134
-
135
-
136
-
137
-
138
-
139
-
140
-
141
-
142
-
143
-
144
-
145
-
146
-
147
-
148
-
149
-
150
-
151
-
152
-
153
-
154
-
155
-
156
-
157
-
158
-
159
-
160
-
161
-
162
-
163
-
164
-
165
-
166
-
167
-
168
-
169
-
170
-
171
-
172
-
173
-
174
-
175
-
176
-
177
-
178
-
179
-
180
-
181
-
182
-
183
-
184
-
185
-
186
-
187
-
188
-
189
-
190
-
191
-
192
-
193
-
194
-
195
-
196
-
197
-
198
-
199
-
200
-
201
-
202
-
203
-
204
-
205
-
206
-
207
-
208
-
209
-
210
-
211
-
212
-
213
-
214
-
215
-
216
-
217
-
218
-
219
-
220
-
221
-
222
-
223
-
224
-
225
-
226
-
227
-
228
-
229
-
230
-
231
-
232
 |
 |

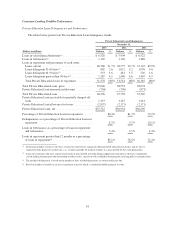
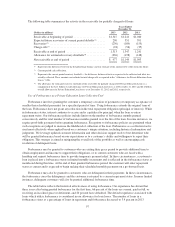
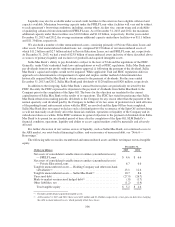
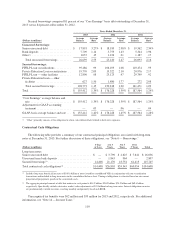
Allowance for FFELP Loan Losses
The following table summarizes changes in the allowance for FFELP Loan losses.
Years Ended December 31,
(Dollars in millions) 2013 2012 2011
Allowance at beginning of period ................................... $ 159 $ 187 $ 189
Provision for FFELP Loan losses .................................... 52 72 86
Charge-offs ..................................................... (78) (92) (78)
Student loan sales ................................................ (14) (8) (10)
Allowance at end of period ........................................ $ 119 $ 159 $ 187
Charge-offs as a percentage of average loans in repayment ............... .10% .10% .08%
Charge-offs as a percentage of average loans in repayment and
forbearance ................................................... .08% .08% .07%
Allowance as a percentage of the ending total loans, gross ................ .12% .13% .14%
Allowance as a percentage of ending loans in repayment ................. .16% .18% .20%
Allowance coverage of charge-offs .................................. 1.5 1.7 2.4
Ending total loans, gross .......................................... $103,672 $124,335 $136,643
Average loans in repayment ........................................ $ 80,822 $ 91,653 $ 94,359
Ending loans in repayment ......................................... $ 76,504 $ 90,731 $ 94,181
103