Sallie Mae 2013 Annual Report Download - page 88
Download and view the complete annual report
Please find page 88 of the 2013 Sallie Mae annual report below. You can navigate through the pages in the report by either clicking on the pages listed below, or by using the keyword search tool below to find specific information within the annual report.-
 1
1 -
2
-
3
-
4
-
5
-
6
-
7
-
8
-
9
-
10
-
11
-
12
-
13
-
14
-
15
-
16
-
17
-
18
-
19
-
20
-
21
-
22
-
23
-
24
-
25
-
26
-
27
-
28
-
29
-
30
-
31
-
32
-
33
-
34
-
35
-
36
-
37
-
38
-
39
-
40
-
41
-
42
-
43
-
44
-
45
-
46
-
47
-
48
-
49
-
50
-
51
-
52
-
53
-
54
-
55
-
56
-
57
-
58
-
59
-
60
-
61
-
62
-
63
-
64
-
65
-
66
-
67
-
68
-
69
-
70
-
71
-
72
-
73
-
74
-
75
-
76
-
77
-
 78
78 -
 79
79 -
 80
80 -
 81
81 -
 82
82 -
 83
83 -
 84
84 -
 85
85 -
 86
86 -
 87
87 -
 88
88 -
 89
89 -
 90
90 -
 91
91 -
 92
92 -
 93
93 -
 94
94 -
 95
95 -
 96
96 -
 97
97 -
 98
98 -
99
-
100
-
101
-
102
-
103
-
104
-
105
-
106
-
107
-
108
-
109
-
110
-
111
-
112
-
113
-
114
-
115
-
116
-
117
-
118
-
119
-
120
-
121
-
122
-
123
-
124
-
125
-
126
-
127
-
128
-
129
-
130
-
131
-
132
-
133
-
134
-
135
-
136
-
137
-
138
-
139
-
140
-
141
-
142
-
143
-
144
-
145
-
146
-
147
-
148
-
149
-
150
-
151
-
152
-
153
-
154
-
155
-
156
-
157
-
158
-
159
-
160
-
161
-
162
-
163
-
164
-
165
-
166
-
167
-
168
-
169
-
170
-
171
-
172
-
173
-
174
-
175
-
176
-
177
-
178
-
179
-
180
-
181
-
182
-
183
-
184
-
185
-
186
-
187
-
188
-
189
-
190
-
191
-
192
-
193
-
194
-
195
-
196
-
197
-
198
-
199
-
200
-
201
-
202
-
203
-
204
-
205
-
206
-
207
-
208
-
209
-
210
-
211
-
212
-
213
-
214
-
215
-
216
-
217
-
218
-
219
-
220
-
221
-
222
-
223
-
224
-
225
-
226
-
227
-
228
-
229
-
230
-
231
-
232
 |
 |

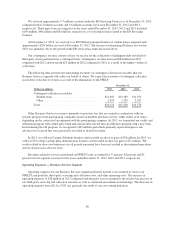
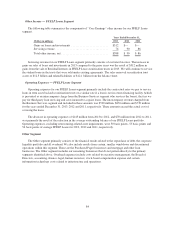
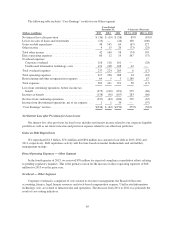
Restructuring and Other Reorganization Expenses — Other Segment
For 2013, restructuring and other reorganization expenses were $64 million compared with $5 million and
$3 million in 2012 and 2011, respectively. For 2013, these consisted of $43 million of expenses related to third-
party costs incurred in connection with our previously announced plan to separate our existing organization into
two, separate publicly-traded companies and $21 million related to severance costs. The $5 million and
$3 million of expenses in 2012 and 2011, respectively, were related to restructuring expenses.
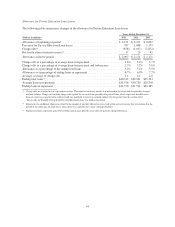
Financial Condition
This section provides additional information regarding the changes related to our loan portfolio assets and
related liabilities as well as credit performance indicators related to our loan portfolio. Certain of these
disclosures will show both GAAP-basis as well as “Core Earnings” basis disclosures. Because certain trusts were
not consolidated prior to the adoption of the new consolidation accounting guidance on January 1, 2010, these
trusts were treated as off-balance sheet for GAAP purposes but we considered them on-balance sheet for “Core
Earnings” purposes. Subsequent to the adoption of the new consolidation accounting guidance on January 1,
2010, this difference no longer exists because all of our trusts are treated as on-balance sheet for GAAP purposes.
Below and elsewhere in the document, “Core Earnings” basis disclosures include all historically (pre-January 1,
2010) off-balance sheet trusts as though they were on-balance sheet. We believe that providing “Core Earnings”
basis disclosures is meaningful because when we evaluate the performance and risk characteristics of the
Company we have always considered the effect of any off-balance sheet trusts as though they were on-balance
sheet.
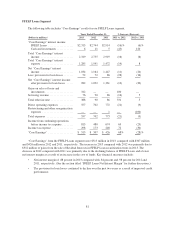
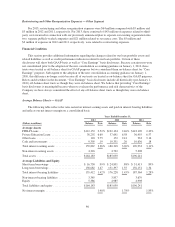
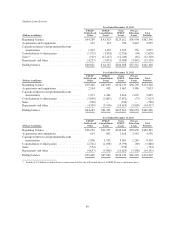
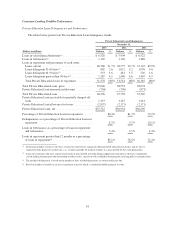
Average Balance Sheets — GAAP
The following table reflects the rates earned on interest-earning assets and paid on interest-bearing liabilities
and reflects our net interest margin on a consolidated basis.
Years Ended December 31,
2013 2012 2011
(Dollars in millions) Balance Rate Balance Rate Balance Rate
Average Assets
FFELP Loans .............................. $112,152 2.52% $132,124 2.46% $143,109 2.42%
Private Education Loans ..................... 38,292 6.60 37,691 6.58 36,955 6.57
Other loans ............................... 118 9.75 172 9.41 233 9.16
Cash and investments ....................... 9,305 .19 10,331 .20 10,636 .18
Total interest-earning assets .................. 159,867 3.36% 180,318 3.20% 190,933 3.11%
Non-interest-earning assets ................... 4,316 4,732 5,308
Total assets ............................... $164,183 $185,050 $196,241
Average Liabilities and Equity
Short-term borrowings ...................... $ 16,730 .99% $ 24,831 .88% $ 31,413 .89%
Long-term borrowings ....................... 138,682 1.47 151,397 1.55 156,151 1.36
Total interest-bearing liabilities ............... 155,412 1.42% 176,228 1.45% 187,564 1.28%
Non-interest-bearing liabilities ................ 3,385 3,837 3,679
Equity ................................... 5,386 4,985 4,998
Total liabilities and equity .................... $164,183 $185,050 $196,241
Net interest margin ......................... 1.98% 1.78% 1.85%
86