Sallie Mae 2013 Annual Report Download - page 213
Download and view the complete annual report
Please find page 213 of the 2013 Sallie Mae annual report below. You can navigate through the pages in the report by either clicking on the pages listed below, or by using the keyword search tool below to find specific information within the annual report.-
 1
1 -
2
-
3
-
4
-
5
-
6
-
7
-
8
-
9
-
10
-
11
-
12
-
13
-
14
-
15
-
16
-
17
-
18
-
19
-
20
-
21
-
22
-
23
-
24
-
25
-
26
-
27
-
28
-
29
-
30
-
31
-
32
-
33
-
34
-
35
-
36
-
37
-
38
-
39
-
40
-
41
-
42
-
43
-
44
-
45
-
46
-
47
-
48
-
49
-
50
-
51
-
52
-
53
-
54
-
55
-
56
-
57
-
58
-
59
-
60
-
61
-
62
-
63
-
64
-
65
-
66
-
67
-
68
-
69
-
70
-
71
-
72
-
73
-
74
-
75
-
76
-
77
-
78
-
79
-
80
-
81
-
82
-
83
-
84
-
85
-
86
-
87
-
88
-
89
-
90
-
91
-
92
-
93
-
94
-
95
-
96
-
97
-
98
-
99
-
100
-
101
-
102
-
103
-
104
-
105
-
106
-
107
-
108
-
109
-
110
-
111
-
112
-
113
-
114
-
115
-
116
-
117
-
118
-
119
-
120
-
121
-
122
-
123
-
124
-
125
-
126
-
127
-
128
-
129
-
130
-
131
-
132
-
133
-
134
-
135
-
136
-
137
-
138
-
139
-
140
-
141
-
142
-
143
-
144
-
145
-
146
-
147
-
148
-
149
-
150
-
151
-
152
-
153
-
154
-
155
-
156
-
157
-
158
-
159
-
160
-
161
-
162
-
163
-
164
-
165
-
166
-
167
-
168
-
169
-
170
-
171
-
172
-
173
-
174
-
175
-
176
-
177
-
178
-
179
-
180
-
181
-
182
-
183
-
184
-
185
-
186
-
187
-
188
-
189
-
190
-
191
-
192
-
193
-
194
-
195
-
196
-
197
-
198
-
199
-
200
-
201
-
202
-
 203
203 -
 204
204 -
 205
205 -
 206
206 -
 207
207 -
 208
208 -
 209
209 -
 210
210 -
 211
211 -
 212
212 -
 213
213 -
 214
214 -
 215
215 -
 216
216 -
 217
217 -
 218
218 -
 219
219 -
 220
220 -
 221
221 -
 222
222 -
 223
223 -
224
-
225
-
226
-
227
-
228
-
229
-
230
-
231
-
232
 |
 |
SLM CORPORATION
NOTES TO CONSOLIDATED FINANCIAL STATEMENTS (Continued)
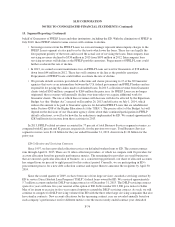
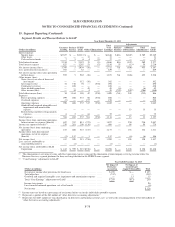
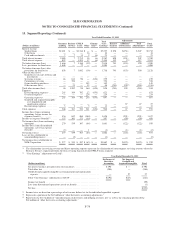
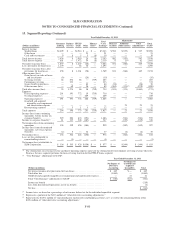
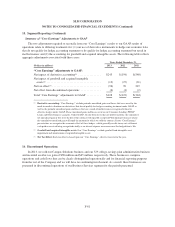
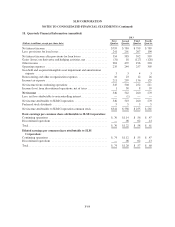
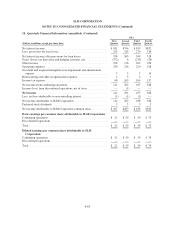
15. Segment Reporting (Continued)
borrower count, defaulted borrower dollar amount, a survey of borrowers, a survey of schools and a survey of ED
personnel. Pursuant to the contract terms related to annual volume allocation of new loans, the maximum any
servicer could be awarded is 40 percent of net new borrowers in that contract year. Our share of new loans
serviced for ED under the contract increased to 18 percent in 2013 from 15 percent in the prior contract year as a
result of our relative standing, as compared to other servicing companies, on the ED Scorecard. We earned $109
million of revenue under the contract for the year ended December 31, 2013.
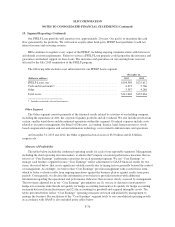
Other
Upromise generates transaction fees through our Upromise consumer savings network. Since inception
through December 31, 2013, members have earned approximately $800 million in rewards by purchasing
products at hundreds of online retailers, booking travel, purchasing a home, dining out, buying gas and groceries,
using the Upromise World MasterCard, or completing other qualified transactions. We earn a fee for the
marketing and administrative services we provide to companies that participate in the Upromise savings network.
We also compete with other loyalty shopping services and companies.
Previously, we provided program management services for 529 college-savings plans through our 529
college-savings plan administration business and our Campus Solutions business provided processing capabilities
to educational institutions designed to help campus business offices increase their services to students and
families. However, in the second quarter of 2013, we sold our Campus Solutions business and recorded an after-
tax gain of $38 million. Additionally, in the fourth quarter of 2013, we sold our 529 college-savings plan
administration business and recorded an after-tax gain of $65 million. The results of both of these businesses are
reported in discontinued operations for all periods presented.
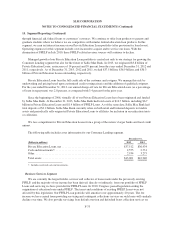
At December 31, 2013 and 2012, the Business Services segment had total assets of $892 million and $867
million, respectively.
FFELP Loans Segment
Our FFELP Loans segment consists of our FFELP Loan portfolio (approximately $104.6 billion as of
December 31, 2013) and the underlying debt and capital funding the loans. We are currently the largest holder of
FFELP Loans. FFELP Loans are insured or guaranteed by state or not-for-profit agencies and are also protected
by contractual rights to recovery from the United States pursuant to guaranty agreements among ED and these
agencies. These guarantees generally cover at least 97 percent of a FFELP Loan’s principal and accrued interest
for loans disbursed. In the case of death, disability or bankruptcy of the borrower, these guarantees cover
100 percent of the loan’s principal and accrued interest.
As a result of the long-term funding used in the FFELP Loan portfolio and the insurance and guarantees
provided on these loans, the net interest margin recorded in the FFELP Loans segment is relatively stable and the
capital we choose to retain with respect to the segment is modest.
In 2013, we sold Residual Interests in FFELP Loan securitization trusts to third parties. We continue to
service the student loans in the trusts under existing agreements. As a result of the sale of the Residual Interests
in FFELP securitizations, we removed securitization trust assets of $12.5 billion and the related liabilities of
$12.1 billion from our balance sheet and recorded a $312 million gain as part of “gains on sales of loans and
investments” for the year ended December 31, 2013.
F-75