Sallie Mae 2013 Annual Report Download - page 175
Download and view the complete annual report
Please find page 175 of the 2013 Sallie Mae annual report below. You can navigate through the pages in the report by either clicking on the pages listed below, or by using the keyword search tool below to find specific information within the annual report.-
 1
1 -
2
-
3
-
4
-
5
-
6
-
7
-
8
-
9
-
10
-
11
-
12
-
13
-
14
-
15
-
16
-
17
-
18
-
19
-
20
-
21
-
22
-
23
-
24
-
25
-
26
-
27
-
28
-
29
-
30
-
31
-
32
-
33
-
34
-
35
-
36
-
37
-
38
-
39
-
40
-
41
-
42
-
43
-
44
-
45
-
46
-
47
-
48
-
49
-
50
-
51
-
52
-
53
-
54
-
55
-
56
-
57
-
58
-
59
-
60
-
61
-
62
-
63
-
64
-
65
-
66
-
67
-
68
-
69
-
70
-
71
-
72
-
73
-
74
-
75
-
76
-
77
-
78
-
79
-
80
-
81
-
82
-
83
-
84
-
85
-
86
-
87
-
88
-
89
-
90
-
91
-
92
-
93
-
94
-
95
-
96
-
97
-
98
-
99
-
100
-
101
-
102
-
103
-
104
-
105
-
106
-
107
-
108
-
109
-
110
-
111
-
112
-
113
-
114
-
115
-
116
-
117
-
118
-
119
-
120
-
121
-
122
-
123
-
124
-
125
-
126
-
127
-
128
-
129
-
130
-
131
-
132
-
133
-
134
-
135
-
136
-
137
-
138
-
139
-
140
-
141
-
142
-
143
-
144
-
145
-
146
-
147
-
148
-
149
-
150
-
151
-
152
-
153
-
154
-
155
-
156
-
157
-
158
-
159
-
160
-
161
-
162
-
163
-
164
-
 165
165 -
 166
166 -
 167
167 -
 168
168 -
 169
169 -
 170
170 -
 171
171 -
 172
172 -
 173
173 -
 174
174 -
 175
175 -
 176
176 -
 177
177 -
 178
178 -
 179
179 -
 180
180 -
 181
181 -
 182
182 -
 183
183 -
 184
184 -
 185
185 -
186
-
187
-
188
-
189
-
190
-
191
-
192
-
193
-
194
-
195
-
196
-
197
-
198
-
199
-
200
-
201
-
202
-
203
-
204
-
205
-
206
-
207
-
208
-
209
-
210
-
211
-
212
-
213
-
214
-
215
-
216
-
217
-
218
-
219
-
220
-
221
-
222
-
223
-
224
-
225
-
226
-
227
-
228
-
229
-
230
-
231
-
232
 |
 |

SLM CORPORATION
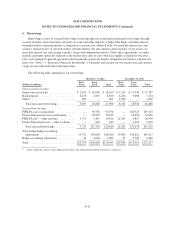
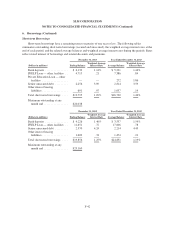
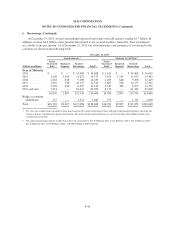
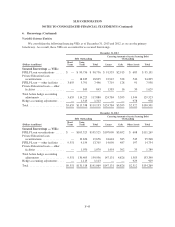
NOTES TO CONSOLIDATED FINANCIAL STATEMENTS (Continued)
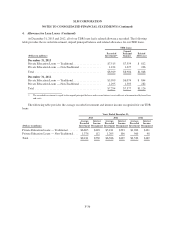
4. Allowance for Loan Losses (Continued)
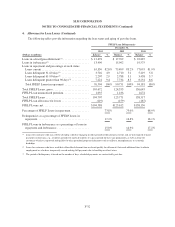
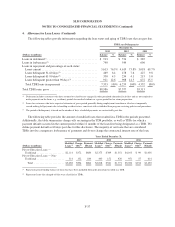
The following tables provide information regarding the loan status and aging of TDR loans that are past due.
TDR Loan Delinquencies
December 31,
2013 2012 2011
(Dollars in millions) Balance % Balance % Balance %
Loans in deferment(1) ................................... $ 913 $ 574 $ 285
Loans in forbearance(2) ................................. 740 544 696
Loans in repayment and percentage of each status:
Loans current ....................................... 5,613 76.5% 4,619 73.8% 3,018 69.7%
Loans delinquent 31-60 days(3) ......................... 469 6.4 478 7.6 427 9.8
Loans delinquent 61-90 days(3) ......................... 330 4.5 254 4.1 215 5.0
Loans delinquent greater than 90 days(3) .................. 921 12.6 908 14.5 672 15.5
Total TDR loans in repayment ......................... 7,333 100% 6,259 100% 4,332 100%
Total TDR loans, gross ................................. $8,986 $7,377 $5,313
(1) Deferment includes customers who have returned to school or are engaged in other permitted educational activities and are not required to
make payments on the loans, e.g., residency periods for medical students or a grace period for bar exam preparation.
(2) Loans for customers who have requested extension of grace period generally during employment transition or who have temporarily
ceased making full payments due to hardship or other factors, consistent with established loan program servicing policies and procedures.
(3) The period of delinquency is based on the number of days scheduled payments are contractually past due.
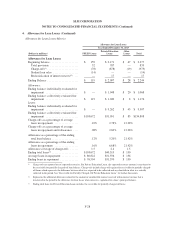
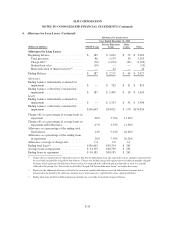
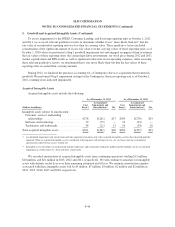
The following table provides the amount of modified loans that resulted in a TDR in the periods presented.
Additionally, the table summarizes charge-offs occurring in the TDR portfolio, as well as TDRs for which a
payment default occurred in the current period within 12 months of the loan first being designated as a TDR. We
define payment default as 60 days past due for this disclosure. The majority of our loans that are considered
TDRs involve a temporary forbearance of payments and do not change the contractual interest rate of the loan.
Years Ended December 31,
2013 2012 2011
(Dollars in millions)
Modified
Loans(1)
Charge-
Offs(2)
Payment-
Default
Modified
Loans(1)
Charge-
Offs(2)
Payment-
Default
Modified
Loans(1)
Charge-
Offs(2)
Payment-
Default
Private Education Loans —
Traditional ..................... $2,114 $372 $680 $2,375 $389 $1,351 $4,103 $ 99 $1,036
Private Education Loans — Non-
Traditional ..................... 314 132 184 443 152 420 951 55 414
Total ....................... $2,428 $504 $864 $2,818 $541 $1,771 $5,054 $154 $1,450
(1) Represents period ending balance of loans that have been modified during the period and resulted in a TDR.
(2) Represents loans that charged off that were classified as TDRs.
F-37