Sallie Mae 2013 Annual Report Download - page 87
Download and view the complete annual report
Please find page 87 of the 2013 Sallie Mae annual report below. You can navigate through the pages in the report by either clicking on the pages listed below, or by using the keyword search tool below to find specific information within the annual report.-
 1
1 -
2
-
3
-
4
-
5
-
6
-
7
-
8
-
9
-
10
-
11
-
12
-
13
-
14
-
15
-
16
-
17
-
18
-
19
-
20
-
21
-
22
-
23
-
24
-
25
-
26
-
27
-
28
-
29
-
30
-
31
-
32
-
33
-
34
-
35
-
36
-
37
-
38
-
39
-
40
-
41
-
42
-
43
-
44
-
45
-
46
-
47
-
48
-
49
-
50
-
51
-
52
-
53
-
54
-
55
-
56
-
57
-
58
-
59
-
60
-
61
-
62
-
63
-
64
-
65
-
66
-
67
-
68
-
69
-
70
-
71
-
72
-
73
-
74
-
75
-
76
-
 77
77 -
 78
78 -
 79
79 -
 80
80 -
 81
81 -
 82
82 -
 83
83 -
 84
84 -
 85
85 -
 86
86 -
 87
87 -
 88
88 -
 89
89 -
 90
90 -
 91
91 -
 92
92 -
 93
93 -
 94
94 -
 95
95 -
 96
96 -
 97
97 -
98
-
99
-
100
-
101
-
102
-
103
-
104
-
105
-
106
-
107
-
108
-
109
-
110
-
111
-
112
-
113
-
114
-
115
-
116
-
117
-
118
-
119
-
120
-
121
-
122
-
123
-
124
-
125
-
126
-
127
-
128
-
129
-
130
-
131
-
132
-
133
-
134
-
135
-
136
-
137
-
138
-
139
-
140
-
141
-
142
-
143
-
144
-
145
-
146
-
147
-
148
-
149
-
150
-
151
-
152
-
153
-
154
-
155
-
156
-
157
-
158
-
159
-
160
-
161
-
162
-
163
-
164
-
165
-
166
-
167
-
168
-
169
-
170
-
171
-
172
-
173
-
174
-
175
-
176
-
177
-
178
-
179
-
180
-
181
-
182
-
183
-
184
-
185
-
186
-
187
-
188
-
189
-
190
-
191
-
192
-
193
-
194
-
195
-
196
-
197
-
198
-
199
-
200
-
201
-
202
-
203
-
204
-
205
-
206
-
207
-
208
-
209
-
210
-
211
-
212
-
213
-
214
-
215
-
216
-
217
-
218
-
219
-
220
-
221
-
222
-
223
-
224
-
225
-
226
-
227
-
228
-
229
-
230
-
231
-
232
 |
 |

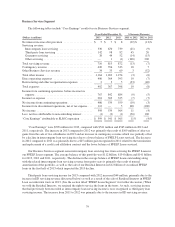
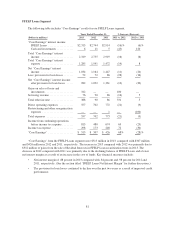
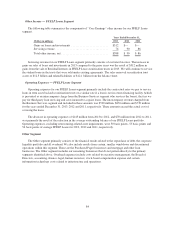
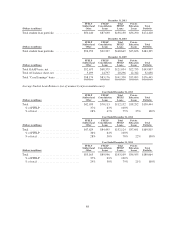
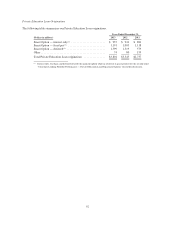
The following table includes “Core Earnings” results for our Other segment.
Years Ended
December 31, % Increase (Decrease)
(Dollars in millions) 2013 2012 2011 2013 vs. 2012 2012 vs. 2011
Net interest loss after provision ....................... $ (36) $ (19) $ (58) 89% (67)%
Losses on sales of loans and investments ................ (10) — (26) 100 (100)
Gains on debt repurchases ............................ 48 145 64 (67) 127
Other income ...................................... 4 15 20 (73) (25)
Total other income ................................. 42 160 58 (74) 176
Direct operating expenses ............................ 80 12 19 567 (37)
Overhead expenses:
Corporate overhead ............................... 116 116 161 — (28)
Unallocated information technology costs ............. 121 108 108 12 —
Total overhead expenses ............................. 237 224 269 6 (17)
Total operating expenses ............................. 317 236 288 34 (18)
Restructuring and other reorganization expenses .......... 64 5 3 1,180 67
Total expenses ..................................... 381 241 291 58 (17)
Loss from continuing operations, before income tax
benefit ......................................... (375) (100) (291) 275 (66)
Income tax benefit .................................. (138) (36) (107) 283 (66)
Net loss from continuing operations .................... (237) (64) (184) 270 (65)
Income from discontinued operations, net of tax expense . . . 1 1 34 — (97)
“Core Earnings” net loss ............................. $(236) $ (63) $(150) 275% (58)%
Net Interest Loss after Provision for Loan Losses
Net interest loss after provision for loan losses includes net interest income related to our corporate liquidity
portfolio as well as net interest income and provision expense related to our other loan portfolios.
Gains on Debt Repurchases
We repurchased $1.3 billion, $711 million and $894 million face amount of our debt in 2013, 2012 and
2011, respectively. Debt repurchase activity will fluctuate based on market fundamentals and our liability
management strategy.
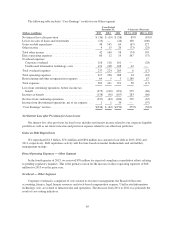
Direct Operating Expenses — Other Segment
In the fourth quarter of 2013, we reserved $70 million for expected compliance remediation efforts relating
to pending regulatory inquiries. This is the primary reason for the increase in direct operating expenses of $68
million for 2013 over the prior year.
Overhead — Other Segment
Corporate overhead is comprised of costs related to executive management, the Board of Directors,
accounting, finance, legal, human resources and stock-based compensation expense. Unallocated information
technology costs are related to infrastructure and operations. The decrease from 2011 to 2012 was primarily the
result of cost-cutting initiatives.
85