Sallie Mae 2013 Annual Report Download - page 220
Download and view the complete annual report
Please find page 220 of the 2013 Sallie Mae annual report below. You can navigate through the pages in the report by either clicking on the pages listed below, or by using the keyword search tool below to find specific information within the annual report.-
 1
1 -
2
-
3
-
4
-
5
-
6
-
7
-
8
-
9
-
10
-
11
-
12
-
13
-
14
-
15
-
16
-
17
-
18
-
19
-
20
-
21
-
22
-
23
-
24
-
25
-
26
-
27
-
28
-
29
-
30
-
31
-
32
-
33
-
34
-
35
-
36
-
37
-
38
-
39
-
40
-
41
-
42
-
43
-
44
-
45
-
46
-
47
-
48
-
49
-
50
-
51
-
52
-
53
-
54
-
55
-
56
-
57
-
58
-
59
-
60
-
61
-
62
-
63
-
64
-
65
-
66
-
67
-
68
-
69
-
70
-
71
-
72
-
73
-
74
-
75
-
76
-
77
-
78
-
79
-
80
-
81
-
82
-
83
-
84
-
85
-
86
-
87
-
88
-
89
-
90
-
91
-
92
-
93
-
94
-
95
-
96
-
97
-
98
-
99
-
100
-
101
-
102
-
103
-
104
-
105
-
106
-
107
-
108
-
109
-
110
-
111
-
112
-
113
-
114
-
115
-
116
-
117
-
118
-
119
-
120
-
121
-
122
-
123
-
124
-
125
-
126
-
127
-
128
-
129
-
130
-
131
-
132
-
133
-
134
-
135
-
136
-
137
-
138
-
139
-
140
-
141
-
142
-
143
-
144
-
145
-
146
-
147
-
148
-
149
-
150
-
151
-
152
-
153
-
154
-
155
-
156
-
157
-
158
-
159
-
160
-
161
-
162
-
163
-
164
-
165
-
166
-
167
-
168
-
169
-
170
-
171
-
172
-
173
-
174
-
175
-
176
-
177
-
178
-
179
-
180
-
181
-
182
-
183
-
184
-
185
-
186
-
187
-
188
-
189
-
190
-
191
-
192
-
193
-
194
-
195
-
196
-
197
-
198
-
199
-
200
-
201
-
202
-
203
-
204
-
205
-
206
-
207
-
208
-
209
-
 210
210 -
 211
211 -
 212
212 -
 213
213 -
 214
214 -
 215
215 -
 216
216 -
 217
217 -
 218
218 -
 219
219 -
 220
220 -
 221
221 -
 222
222 -
 223
223 -
 224
224 -
 225
225 -
 226
226 -
 227
227 -
 228
228 -
 229
229 -
 230
230 -
231
-
232
 |
 |

SLM CORPORATION
NOTES TO CONSOLIDATED FINANCIAL STATEMENTS (Continued)
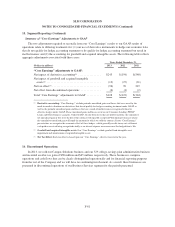
16. Discontinued Operations (Continued)
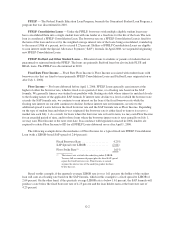
The following table summarizes our discontinued assets and liabilities at December 31, 2013 and 2012.
At December 31,
(Dollars in millions) 2013 2012
Assets:
Cash and equivalents ....................................... $ 5 $ 33
Other assets .............................................. 98 202
Assets of discontinued operations ............................. $103 $235
Liabilities:
Liabilities of discontinued operations .......................... $ 94 $168
At December 31, 2013, other assets of our discontinued operations and the offsetting liability consisted
primarily of funds held in accordance with contractual requirements on behalf of the acquirer of our Campus
Solutions business pending remittance to their school clients.
The following table summarizes our discontinued operations.
Years Ended December 31,
(Dollars in millions) 2013 2012 2011
Operations:
Income (loss) from discontinued operations before income tax
expense (benefit) ................................... $126 $(3) $55
Income tax expense (benefit) ............................ 20 (1) 20
Income (loss) from discontinued operations, net of tax expense
(benefit) .......................................... $106 $(2) $35
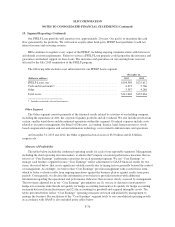
17. Concentrations of Risk
Our business is primarily focused in providing and/or servicing to help students and their families save, plan
and pay for college. We primarily originate, service and/or collect loans made to students and their families to
finance the cost of their education. We provide funding, delivery and servicing support for education loans in the
United States, through our Private Education Loan programs and as a servicer and collector of loans for ED. In
addition we are the largest holder, servicer and collector of loans under the discontinued FFELP. Because of this
concentration in one industry, we are exposed to credit, legislative, operational, regulatory, and liquidity risks
associated with the student loan industry.
Concentration Risk in the Revenues Associated with Private Education Loans
We compete in the private credit lending business with banks and other consumer lending institutions, some
with strong consumer brand name recognition and greater financial resources. We compete based on our
products, origination capability and customer service. To the extent our competitors compete aggressively or
more effectively, we could lose market share to them or subject our existing loans to refinancing risk. Our
product offerings may not prove to be profitable and may result in higher than expected losses.
We are a leading provider of saving- and paying-for-college products and programs. This concentration
gives us a competitive advantage in the marketplace. This concentration also creates risks in our business,
F-82