Sallie Mae 2013 Annual Report Download - page 190
Download and view the complete annual report
Please find page 190 of the 2013 Sallie Mae annual report below. You can navigate through the pages in the report by either clicking on the pages listed below, or by using the keyword search tool below to find specific information within the annual report.-
 1
1 -
2
-
3
-
4
-
5
-
6
-
7
-
8
-
9
-
10
-
11
-
12
-
13
-
14
-
15
-
16
-
17
-
18
-
19
-
20
-
21
-
22
-
23
-
24
-
25
-
26
-
27
-
28
-
29
-
30
-
31
-
32
-
33
-
34
-
35
-
36
-
37
-
38
-
39
-
40
-
41
-
42
-
43
-
44
-
45
-
46
-
47
-
48
-
49
-
50
-
51
-
52
-
53
-
54
-
55
-
56
-
57
-
58
-
59
-
60
-
61
-
62
-
63
-
64
-
65
-
66
-
67
-
68
-
69
-
70
-
71
-
72
-
73
-
74
-
75
-
76
-
77
-
78
-
79
-
80
-
81
-
82
-
83
-
84
-
85
-
86
-
87
-
88
-
89
-
90
-
91
-
92
-
93
-
94
-
95
-
96
-
97
-
98
-
99
-
100
-
101
-
102
-
103
-
104
-
105
-
106
-
107
-
108
-
109
-
110
-
111
-
112
-
113
-
114
-
115
-
116
-
117
-
118
-
119
-
120
-
121
-
122
-
123
-
124
-
125
-
126
-
127
-
128
-
129
-
130
-
131
-
132
-
133
-
134
-
135
-
136
-
137
-
138
-
139
-
140
-
141
-
142
-
143
-
144
-
145
-
146
-
147
-
148
-
149
-
150
-
151
-
152
-
153
-
154
-
155
-
156
-
157
-
158
-
159
-
160
-
161
-
162
-
163
-
164
-
165
-
166
-
167
-
168
-
169
-
170
-
171
-
172
-
173
-
174
-
175
-
176
-
177
-
178
-
179
-
 180
180 -
 181
181 -
 182
182 -
 183
183 -
 184
184 -
 185
185 -
 186
186 -
 187
187 -
 188
188 -
 189
189 -
 190
190 -
 191
191 -
 192
192 -
 193
193 -
 194
194 -
 195
195 -
 196
196 -
 197
197 -
 198
198 -
 199
199 -
 200
200 -
201
-
202
-
203
-
204
-
205
-
206
-
207
-
208
-
209
-
210
-
211
-
212
-
213
-
214
-
215
-
216
-
217
-
218
-
219
-
220
-
221
-
222
-
223
-
224
-
225
-
226
-
227
-
228
-
229
-
230
-
231
-
232
 |
 |

SLM CORPORATION
NOTES TO CONSOLIDATED FINANCIAL STATEMENTS (Continued)
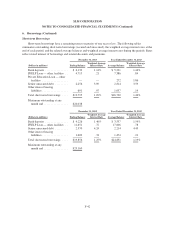
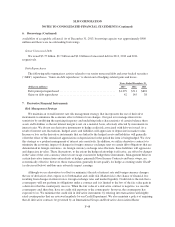
7. Derivative Financial Instruments (Continued)
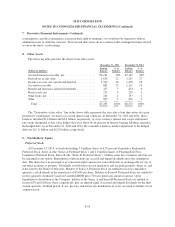
The above fair values include adjustments for counterparty credit risk for both when we are exposed to the
counterparty, net of collateral postings, and when the counterparty is exposed to us, net of collateral postings.
The net adjustments decreased the overall net asset positions at December 31, 2013 and 2012 by $91 million and
$111 million, respectively. In addition, the above fair values reflect adjustments for illiquid derivatives as
indicated by a wide bid/ask spread in the interest rate indices to which the derivatives are indexed. These
adjustments decreased the overall net asset positions at December 31, 2013 and 2012 by $84 million and
$107 million, respectively.
Cash Flow Fair Value Trading Total
(Dollars in billions)
Dec. 31,
2013
Dec. 31,
2012
Dec. 31,
2013
Dec. 31,
2012
Dec. 31,
2013
Dec. 31,
2012
Dec. 31,
2013
Dec. 31,
2012
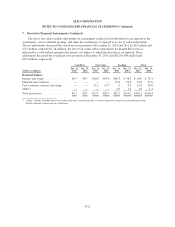
Notional Values:
Interest rate swaps ................ $0.7 $0.7 $16.0 $15.8 $46.3 $ 56.9 $ 63.0 $ 73.4
Floor Income Contracts ............ — — — — 31.8 51.6 31.8 51.6
Cross-currency interest rate swaps .... — — 11.1 13.7 .3 0.3 11.4 14.0
Other(1) ......................... — — — — 3.9 1.4 3.9 1.4
Total derivatives .................. $0.7 $0.7 $27.1 $29.5 $82.3 $110.2 $110.1 $140.4
(1) “Other” includes embedded derivatives bifurcated from securitization debt, as well as derivatives related to our Total Return Swap
Facility and back-to-back private credit floors.
F-52